Step area Chart in Flutter Cartesian Charts (SfCartesianChart)
17 Mar 20266 minutes to read
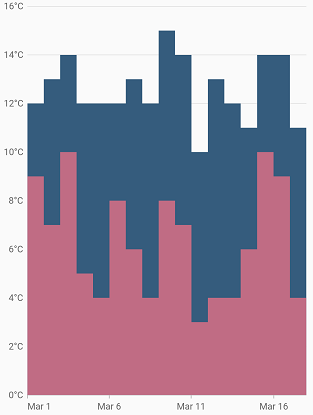
To render a step area chart, create an instance of StepAreaSeries, and add it to the series collection property of SfCartesianChart. The following properties can be used to customize the appearance of the step area chart.
-
color- changes the color of the series. -
opacity- controls the transparency of the chart series. -
width- changes the stroke width of the series.
@override
    Widget build(BuildContext context) {
        return Scaffold(
            body: Center(
                child: Container(
                    child: SfCartesianChart(
                        primaryXAxis: DateTimeAxis(),
                        series: <CartesianSeries>[
                            StepAreaSeries<ChartData, DateTime>(
                                dataSource: chartData,
                                xValueMapper: (ChartData data, _) => data.x,
                                yValueMapper: (ChartData data, _) => data.y
                            ),
                            StepAreaSeries<ChartData, DateTime>(
                                dataSource: chartData1,
                                xValueMapper: (ChartData data, _) => data.x,
                                yValueMapper: (ChartData data, _) => data.y
                            )
                        ]
                    )
                )
            )
        );
    }
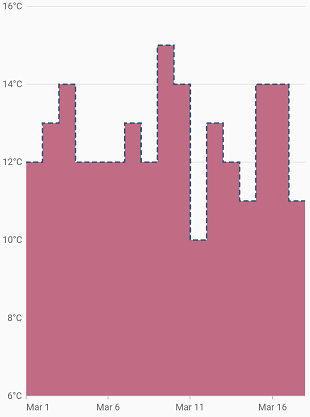
Dashed step area
The dashArray property of the StepAreaSeries is used to render step area series with dashes. The odd value is considered as the rendering size and the even value is considered as gap.
@override
    Widget build(BuildContext context) {
        return Scaffold(
            body: Center(
                child: Container(
                    child: SfCartesianChart(
                        primaryXAxis: DateTimeAxis(),
                        series: <CartesianSeries>[
                            StepAreaSeries<ChartData, DateTime>(
                                dataSource: chartData,
                                dashArray: <double>[5, 5],
                                xValueMapper: (ChartData data, _) => data.x,
                                yValueMapper: (ChartData data, _) => data.y
                            )
                        ]
                    )
                )
            )
        );
    }