Line Chart in Flutter Cartesian Charts (SfCartesianChart)
23 Jul 202511 minutes to read
To create a Flutter line chart quickly, you can check this video.
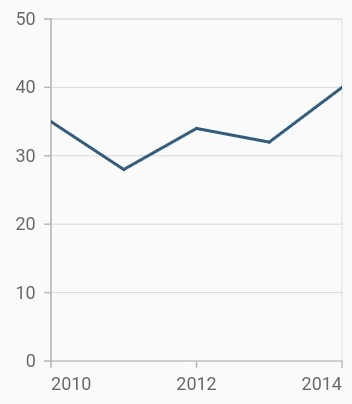
To render a line chart, create an instance of LineSeries, and add it to the series collection property of SfCartesianChart. The following properties can be used to customize the appearance:
-
color- changes the color of the line. -
opacity- controls the transparency of the chart series. -
width- changes the stroke width of the line.
@override
    Widget build(BuildContext context) {
        final List<ChartData> chartData = [
            ChartData(2010, 35),
            ChartData(2011, 28),
            ChartData(2012, 34),
            ChartData(2013, 32),
            ChartData(2014, 40)
        ];

        return Scaffold(
            body: Center(
                child: Container(
                    child: SfCartesianChart(
                        series: <CartesianSeries>[
                            // Renders line chart
                            LineSeries<ChartData, int>(
                                dataSource: chartData,
                                xValueMapper: (ChartData data, _) => data.x,
                                yValueMapper: (ChartData data, _) => data.y
                            )
                        ]
                    )
                )
            )
        );
    }

    class ChartData {
        ChartData(this.x, this.y);
        final int x;
        final double y;
    }
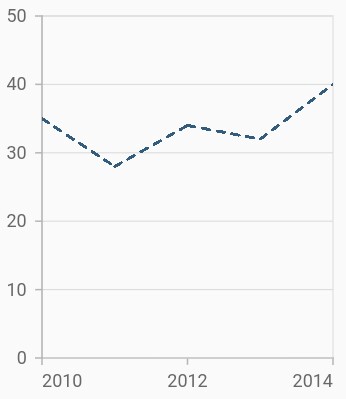
Dashed line
The dashArray property of LineSeries is used to render line series with dashes. The odd value is considered as the rendering size and the even value is considered as the gap.
@override
    Widget build(BuildContext context) {
        final List<ChartData> chartData = [
            ChartData(2010, 35),
            ChartData(2011, 28),
            ChartData(2012, 34),
            ChartData(2013, 32),
            ChartData(2014, 40)
        ];
        return Scaffold(
            body: Center(
                child: Container(
                    child: SfCartesianChart(
                        series: <CartesianSeries>[
                            LineSeries<ChartData, int>(
                                dataSource: chartData,
                                // Dash values for line
                                dashArray: <double>[5, 5],
                                xValueMapper: (ChartData data, _) => data.x,
                                yValueMapper: (ChartData data, _) => data.y)
                        ]
                    )
                )
            )
        );
  }
See Also
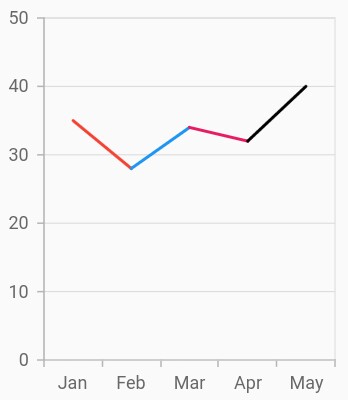
Multi-colored line
To render a multi-colored line series, map the individual colors to the data using the pointColorMapper property.
@override
    Widget build(BuildContext context) {
        return Scaffold(
            body: Center(
                child: Container(
                    child: SfCartesianChart(
                        primaryXAxis: CategoryAxis(),
                        series: <CartesianSeries>[
                            LineSeries<ChartData, String>(
                                dataSource: [
                                    ChartData('Jan', 35, Colors.red),
                                    ChartData('Feb', 28, Colors.green),
                                    ChartData('Mar', 34, Colors.blue),
                                    ChartData('Apr', 32, Colors.pink),
                                    ChartData('May', 40, Colors.black)
                                ],
                                // Bind the color for all the data points from the data source
                                pointColorMapper: (ChartData data, _) => data.color,
                                xValueMapper: (ChartData data, _) => data.x,
                                yValueMapper: (ChartData data, _) => data.y
                            )
                        ]
                    )
                )
            )
        );
    }

    class ChartData {
        ChartData(this.x, this.y, this.color);
        final String x;
        final double y;
        final Color color;
    }