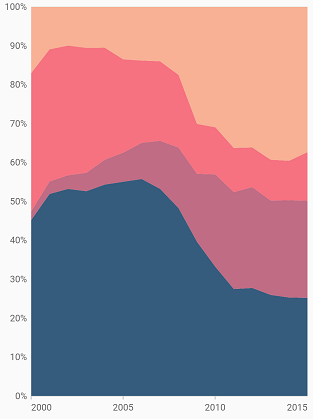
100% Stacked area Chart in Flutter Cartesian Charts (SfCartesianChart)
17 Mar 20266 minutes to read
To create a Flutter 100% stacked area chart quickly, you can check this video.
To render a 100% stacked area chart, create an instance of StackedArea100Series and add to the series collection property of SfCartesianChart. You can use the following properties to customize the 100% stacked area appearance.
-
color- changes the color of the series. -
opacity- controls the transparency of the chart series. -
borderWidth- changes the stroke width of the series. -
borderColor- changes the stroke color of the series. -
borderDrawMode- specifies the type of the border mode and it defaults toBorderDrawMode.top.
@override
    Widget build(BuildContext context) {
        return Scaffold(
            body: Center(
                child: Container(
                    child: SfCartesianChart(
                        primaryXAxis: DateTimeAxis(),
                        series: <CartesianSeries>[
                            StackedArea100Series<ChartData, DateTime>(
                                dataSource: chartData,
                                xValueMapper: (ChartData data, _) => data.x,
                                yValueMapper: (ChartData data, _) => data.y1
                            ),
                            StackedArea100Series<ChartData, DateTime>(
                                dataSource: chartData,
                                xValueMapper: (ChartData data, _) => data.x,
                                yValueMapper: (ChartData data, _) => data.y2
                            ),
                            StackedArea100Series<ChartData, DateTime>(
                                dataSource: chartData,
                                xValueMapper: (ChartData data, _) => data.x,
                                yValueMapper: (ChartData data, _) => data.y3
                            ),
                            StackedArea100Series<ChartData, DateTime>(
                                dataSource: chartData,
                                xValueMapper: (ChartData data, _) => data.x,
                                yValueMapper: (ChartData data, _) => data.y4
                            )
                        ]
                    )
                )
            )
        );
    }