Flutter Cartesian Charts Customization (SfCartesianChart)
16 Apr 20265 minutes to read
Chart sizing
Chart renders based on the parent widget size. If you need the chart to be rendered in specific size, then set the size(width/height) to the parent widget.
You can also customize the following properties:
-
backgroundColor- used to change the background color of the chart. -
borderWidth- used to change the border width. -
borderColor- used to change the color of the chart border.
@override
    Widget build(BuildContext context) {
      return Scaffold(
        body: SafeArea(
          child: Center(
            child: Container(
              // height of the Container widget
              height: 300,
              // width of the Container widget
              width: 350,
              child: SfCartesianChart()
            )
          )
        )
      );
    }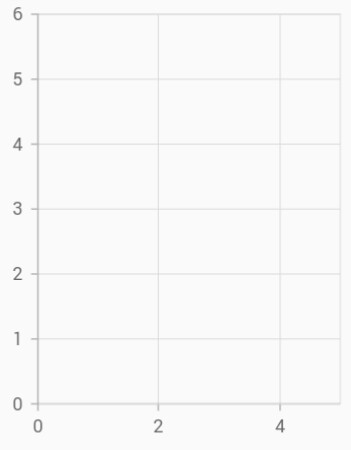
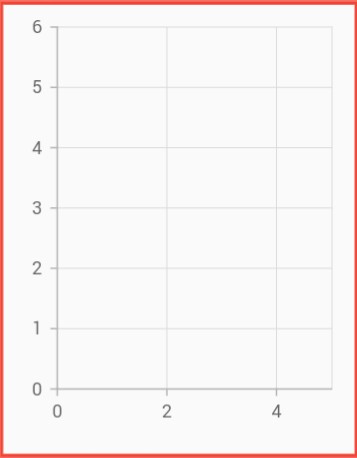
Chart margin
Margin to the chart can be specified using the margin property.
@override
    Widget build(BuildContext context) {
      return Scaffold(
        body: SafeArea(
          child: Center(
        child: Container(
          height: 300,
          width: 350,
          child: SfCartesianChart(
              borderColor: Colors.red,
              borderWidth: 2,
              // Sets 15 logical pixels as margin for all the 4 sides.
              margin: EdgeInsets.all(15)
              )
            )
          )
        )
      );
    }
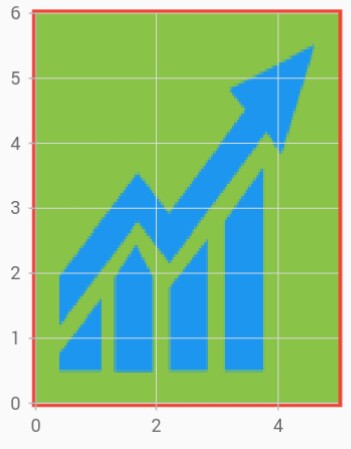
Plot area customization
You can customize the plot area of the chart using the below properties.
-
plotAreaBackgroundColor- used to change the plot area background color. -
plotAreaBorderColor- used to change the stroke color of the plot area. -
plotAreaBorderWidth- used to change the stroke width of the plot area. -
plotAreaBackgroundImage- used to set the image path.
@override
    Widget build(BuildContext context) {
      return Scaffold(
        body: SafeArea(
          child: Center(
            child: Container(
              height: 300,
              width: 350,
              child: SfCartesianChart(
                plotAreaBorderWidth: 5,
                plotAreaBorderColor: Colors.red,
                plotAreaBackgroundColor: Colors.lightGreen,
                plotAreaBackgroundImage: 'images/livechart.png'
              )
            )
          )
        )
      );
    }