Selection in Flutter Cartesian Charts (SfCartesianChart)
1 Aug 202524 minutes to read
The selection feature in chart let you to select a segment in a series or the series itself. This feature allows you to select either individual or cluster of segments in the chart series.
late SelectionBehavior _selectionBehavior;

    @override
    void initState(){
      _selectionBehavior = SelectionBehavior(
        // Enables the selection
        enable: true);
        super.initState();
    }

    @override
    Widget build(BuildContext context) {
        final List<ChartData> chartData = [
            ChartData('USA', 6),
            ChartData('China', 11),
            ChartData('UK', 9),
            ChartData('Japan', 14),
            ChartData('France', 10),
        ];
        return Scaffold(
            body: Center(
                child: Container(
                    child: SfCartesianChart(
                        primaryXAxis: CategoryAxis(),
                        series: <CartesianSeries>[
                            ColumnSeries<ChartData, String>(
                                dataSource: chartData,
                                xValueMapper: (ChartData data, _) => data.x,
                                yValueMapper: (ChartData data, _) => data.y,
                                selectionBehavior: _selectionBehavior
                            )
                        ]
                    )
                )
            )
        );
    }

    class ChartData {
        ChartData(this.x, this.y);
        final double x;
        final double? y;
      }
Customizing the segments
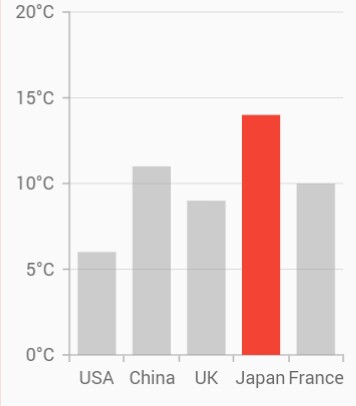
You can customize the segments using the below properties.
-
selectedColor- used to change the background color of selected segment. -
unselectedColor- used to change the background color of unselected segment. -
selectedBorderColor- used to change the stroke color of the selected segment. -
selectedBorderWidth- used to change the stroke width of the selected segment. -
unselectedBorderColor- used to change the stroke color of the unselected segment. -
unselectedBorderWidth- used to change the stroke width of the unselected segment. -
selectedOpacity- used to control the transparency of the selected segment. -
unselectedOpacity- used to control the transparency of the unselected segment. -
selectionController- to customize the minimum range of selected series or points.
late SelectionBehavior _selectionBehavior;

    @override
    void initState(){
     _selectionBehavior = SelectionBehavior(
            enable: true,
            selectedColor: Colors.red,
            unselectedColor: Colors.grey);
        super.initState();
    }

    @override
    Widget build(BuildContext context) {
        final List<ChartData> chartData = [
            ChartData('USA', 6),
            ChartData('China', 11),
            ChartData('UK', 9),
            ChartData('Japan', 14),
            ChartData('France', 10),
        ];
        return Scaffold(
            body: Center(
                child: Container(
                    child: SfCartesianChart(
                        primaryXAxis: CategoryAxis(),
                        series: <CartesianSeries<ChartData, String>>[
                            ColumnSeries<ChartData, String>(
                                dataSource: chartData,
                                selectionBehavior: _selectionBehavior
                                xValueMapper: (ChartData data, _) => data.x,
                                yValueMapper: (ChartData data, _) => data.y)
                            ]
                        )
                    )
                )
            );
        }

    class ChartData {
        ChartData(this.x, this.y);
        final String x;
        final double? y;
      }
Selection modes
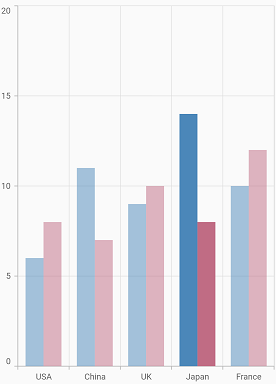
The selection features allows you to select segments in following modes using selectionType property of chart.
-
SelectionType.Point- selects the individual data point. -
SelectionType.Series- selects the entire series. -
SelectionType.Cluster- selects the cluster of points of different series i.e selects the points with same index in each series.
late SelectionBehavior _selectionBehavior;

    @override
    void initState() {
        _selectionBehavior = SelectionBehavior(enable: true);
        super.initState();
    }

    @override
    Widget build(BuildContext context) {
        final List<ChartData> chartData = [
            ChartData('USA', 6, 8),
            ChartData('China', 11, 7),
            ChartData('UK', 9, 10),
            ChartData('Japan', 14, 8),
            ChartData('France', 10, 12),
        ];
        return Scaffold(
            body: Center(
                child: Container(
                    child: SfCartesianChart(
                    // Mode of selection
                    selectionType: SelectionType.cluster,
                    primaryXAxis: CategoryAxis(),
                    series: <CartesianSeries<ChartData, String>>[
                        ColumnSeries<ChartData, String>(
                        dataSource: chartData,
                        selectionBehavior: _selectionBehavior,
                        xValueMapper: (ChartData data, _) => data.x,
                        yValueMapper: (ChartData data, _) => data.y
                        ),
                        ColumnSeries<ChartData, String>(
                        dataSource: chartData,
                        selectionBehavior: _selectionBehavior,
                        xValueMapper: (ChartData data, _) => data.x,
                        yValueMapper: (ChartData data, _) => data.y1
                        )],
                    )
                )
            )
        );
    }

    class ChartData {
        ChartData(this.x, this.y, this.y1);
        final String x;
        final double y;
        final double y1;
    }
Multi-selection
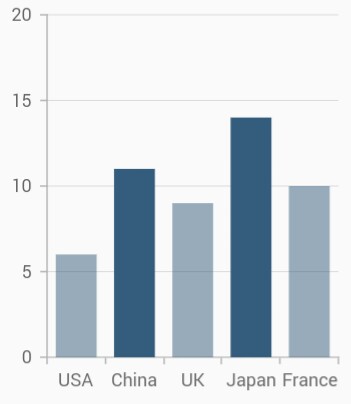
Multiple selection can be enabled using the enableMultiSelection property of chart.
late SelectionBehavior _selectionBehavior;

    @override
    void initState() {
        _selectionBehavior = SelectionBehavior(enable: true);
        super.initState();
    }

    @override
    Widget build(BuildContext context) {
        final List<ChartData> chartData = [
        ChartData('USA', 6),
        ChartData('China', 11),
        ChartData('UK', 9),
        ChartData('Japan', 14),
        ChartData('France', 10),
        ];

    return Scaffold(
      body: Center(
        child: Container(
          child: SfCartesianChart(
            // Enables multiple selection
            enableMultiSelection: true,
            primaryXAxis: CategoryAxis(),
            series: <CartesianSeries<ChartData, String>>[
              ColumnSeries<ChartData, String>(
                  dataSource: chartData,
                  selectionBehavior: _selectionBehavior,
                  xValueMapper: (ChartData data, _) => data.x,
                  yValueMapper: (ChartData data, _) => data.y)],
                )
             )
          )
      );
    }
Selection on initial rendering
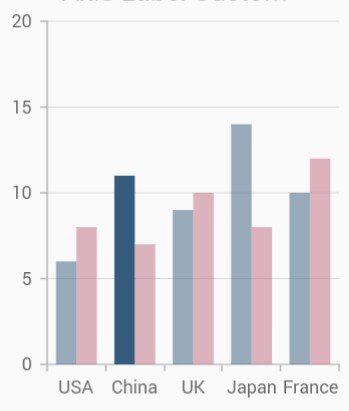
You can select a point or series programmatically on a chart using initialSelectedDataIndexes property of the CartesianSeries.
late SelectionBehavior _selectionBehavior;

    @override
    void initState(){
     _selectionBehavior = SelectionBehavior(
            enable: true);
        super.initState();
    }

    @override
    Widget build(BuildContext context) {
        final List<ChartData> chartData = [
            ChartData('USA', 6, 8),
            ChartData('China', 11, 7),
            ChartData('UK', 9, 10),
            ChartData('Japan', 14, 8),
            ChartData('France', 10, 12),
        ];
        return Scaffold(
            body: Center(
                child: Container(
                    child: SfCartesianChart(
                        // Mode of selection
                        selectionType: SelectionType.cluster,
                        primaryXAxis: CategoryAxis(),
                        series: <CartesianSeries<ChartData, String>>[
                        ColumnSeries<ChartData, String>(
                            dataSource: chartData,
                            initialSelectedDataIndexes: <int>[1],
                            selectionBehavior: _selectionBehavior,
                            xValueMapper: (ChartData data, _) => data.x,
                            yValueMapper: (ChartData data, _) => data.y),
                        ColumnSeries<ChartData, String>(
                            dataSource: chartData,
                            selectionBehavior: _selectionBehavior,
                            xValueMapper: (ChartData data, _) => data.x,
                            yValueMapper: (ChartData data, _) => data.y1),
                        ],
                    )
                )
            )
        );
    }
    class ChartData {
        ChartData(this.x, this.y, this.y1);
        final String x;
        final double y;
        final double y1;
    }
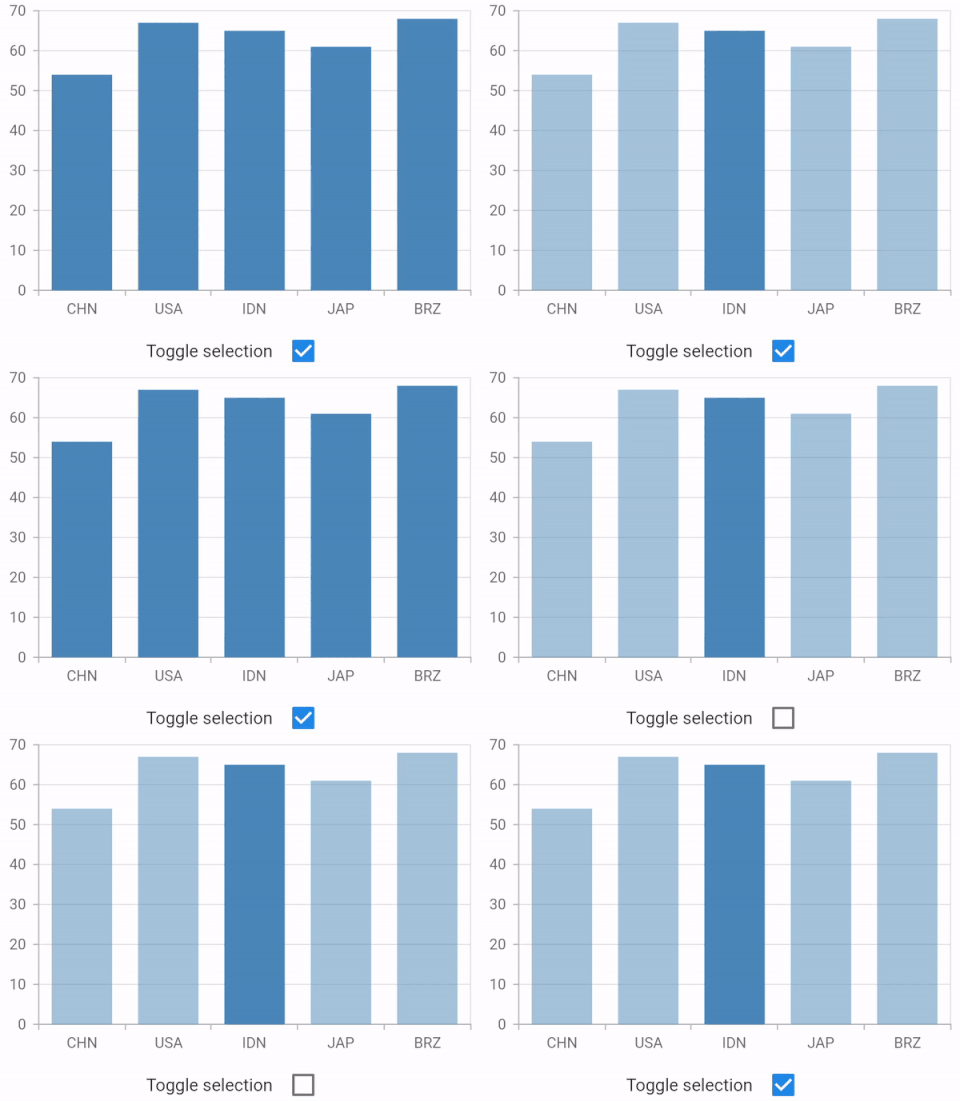
Toggle selection
You can decide, whether to deselect the selected data point/series or remain selected when interacted with it again by setting the toggleSelection property true or false. If set to true, deselection will be performed else the point will not get deselected.
This works even while calling public methods, in various selection modes, with multi-selection, and also on dynamic changes.
Defaults to true.
late SelectionBehavior _selectionBehavior;

    @override
    void initState(){
      _selectionBehavior =  SelectionBehavior(
                           enable: true,
                           toggleSelection: false,
                        );
      super.initState();
    }

    @override
    Widget build(BuildContext context) {
        final List<ChartData> chartData = [
            ChartData('CHN', 52),
            ChartData('USA', 69),
            ChartData('IDN', 68),
            ChartData('JAP', 61),
            ChartData('BRA', 69),
        ];
        return Scaffold(
            body: Center(
                child: Container(
                    child: SfCartesianChart(
                        primaryXAxis: CategoryAxis(),
                        series: <ColumnSeries<ChartData, String>>[
                          ColumnSeries<ChartData, String>(
                           dataSource: chartData1,
                           xValueMapper: (ChartData data, _) => data.x,
                           yValueMapper: (ChartData data, _) => data.y,
                           selectionBehavior: _selectionBehavior)
                    ]
                )
            )
        )
      );
    }
Also refer selection event for customizing the selection further.
See Also
Note:
chartDatain the above code snippets is a class type list and holds the data for binding to the chart series. Refer Bind data source topic for more details.