Methods in Flutter Cartesian Charts (SfCartesianChart)
5 Dec 202524 minutes to read
Methods in Plot band
drawRect method
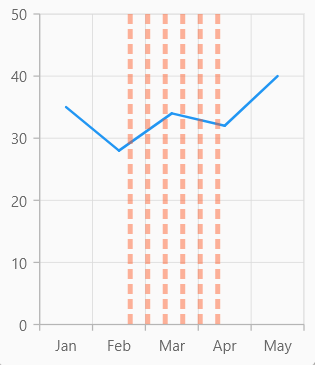
The drawRect method is used to customize the appearance of the plot band.
This following code sample shows how to customize the appearance of the plot band by using drawRect method.
late List<_SalesData> _data;

    @override
    void initState() {
      _data = <_SalesData>[
        _SalesData('Jan', 35),
        _SalesData('Feb', 28),
        _SalesData('Mar', 34),
        _SalesData('Apr', 32),
        _SalesData('May', 40),
      ];
      super.initState();
    }

    @override
    Widget build(BuildContext context) {
      final int startIndex = 1; // Feb
      final int endIndex = 3; // Apr

      return Scaffold(
        body: SfCartesianChart(
          primaryXAxis: CategoryAxis(
            plotBands: <PlotBand>[
              CustomStripedPlotBand(
                start: startIndex.toDouble(),
                end: endIndex.toDouble(),
                color: const Color(0xFFFFF3E0),
                opacity: 0.9,
                borderColor: Colors.deepOrange,
                borderWidth: 1.2,
                patternColor: Colors.deepOrange,
                stripeOpacity: 0.45,
                stripeWidth: 4.0,
                stripeSpacing: 10.0,
                shouldRenderAboveSeries: true,
              ),
            ],
          ),
          series: <CartesianSeries<_SalesData, String>>[
            LineSeries<_SalesData, String>(),
          ],
        ),
      );
    }

    class _SalesData {
      _SalesData(this.year, this.sales);
      final String year;
      final double sales;
    }

    /// Custom striped plot band that draws vertical dashed stripes inside the band.
    class CustomStripedPlotBand extends PlotBand {
      const CustomStripedPlotBand({
        super.isVisible,
        super.start,
        super.end,
        super.color = const Color(0xFFE0E0E0),
        super.opacity,
        super.borderColor,
        super.borderWidth = 0,
        super.shouldRenderAboveSeries,

        // Custom stripe properties
        this.patternColor = const Color(0xFF000000),
        this.stripeOpacity = 0.25,
        this.stripeWidth = 4.0,
        this.stripeSpacing = 6.0,
      });

      final Color patternColor;
      final double stripeOpacity;
      final double stripeWidth;
      final double stripeSpacing;

      @override
      void drawRect(
        Canvas canvas,
        Rect rect,
        Paint fillPaint, [
        Paint? strokePaint,
      ]) {
        // Early return if bounds width is invalid
        if (rect.width <= 0) {
          return;
        }

        final paint = Paint()
          ..color = patternColor.withOpacity(stripeOpacity)
          ..style = PaintingStyle.fill;

        canvas.save();
        canvas.clipRect(rect);

        // Fixed dash pattern based on stripe width
        final double dashLength = stripeWidth * 2;
        final double gapLength = stripeWidth;
        // Calculate number of stripes based on width
        final double totalWidth = rect.width;
        final double stripeSpacing = (stripeWidth + this.stripeSpacing);
        final int numberOfStripes = math.max(
          1,
          (totalWidth / stripeSpacing).floor(),
        );

        // Draw stripes
        for (int i = 0; i < numberOfStripes; i++) {
          final double x = rect.left + (i * stripeSpacing) + (stripeSpacing / 2);
          if (x + stripeWidth > rect.right) break;
          // Use absolute positioning for Y coordinates
          final double yStart = math.min(rect.top, rect.bottom);
          final double yEnd = math.max(rect.top, rect.bottom);
          // Draw dashed pattern
          double currentY = yStart;
          bool drawDash = true;
          while (currentY < yEnd) {
            if (drawDash) {
              final double segmentEnd = math.min(currentY + dashLength, yEnd);
              canvas.drawRect(
                Rect.fromLTWH(x, currentY, stripeWidth, segmentEnd - currentY),
                paint,
              );
              currentY = segmentEnd;
            } else {
              currentY = math.min(currentY + gapLength, yEnd);
            }
            drawDash = !drawDash;
          }
        }
        canvas.restore();
      }
    }
drawText method
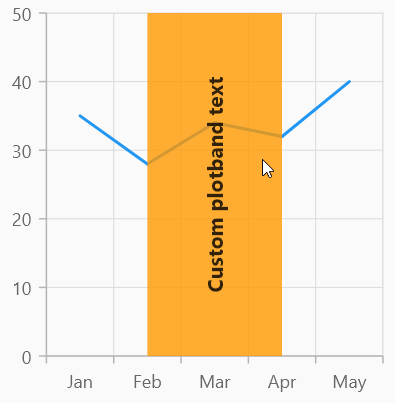
The drawText method is used to customize the text and text style of the plot band.
The following code sample shows how to customize the plot band text and text style using the drawText method.
late List<_SalesData> _data;

    @override
    void initState() {
      _data = <_SalesData>[
        _SalesData('Jan', 35),
        _SalesData('Feb', 28),
        _SalesData('Mar', 34),
        _SalesData('Apr', 32),
        _SalesData('May', 40),
      ];
      super.initState();
    }

    @override
    Widget build(BuildContext context) {
      final int startIndex = 1; // Feb
      final int endIndex = 3; // Apr

      return Scaffold(
        body: SfCartesianChart(
          primaryXAxis: CategoryAxis(
            plotBands: <PlotBand>[
              CustomStripedPlotBand(
                start: startIndex.toDouble(),
                end: endIndex.toDouble(),
                color: Colors.orange,
                opacity: 0.8,
                text: "Custom plotband text",
                textStyle: TextStyle(
                  color: Colors.black,
                  fontSize: 14,
                  fontWeight: FontWeight.bold,
                ),
                shouldRenderAboveSeries: true,
              ),
            ],
          ),
          series: <CartesianSeries<_SalesData, String>>[
            LineSeries<_SalesData, String>(),
          ],
        ),
      );
    }

    class _SalesData {
      _SalesData(this.year, this.sales);
      final String year;
      final double sales;
    }

    /// Custom striped plot band that draws vertical dashed stripes inside the band.
    class CustomStripedPlotBand extends PlotBand {
      const CustomStripedPlotBand({
        super.isVisible,
        super.start,
        super.end,
        super.color,
        super.opacity,
        super.textAngle,
        super.text,
        super.textStyle,
        super.shouldRenderAboveSeries,
      });

      @override
      void drawText(Canvas canvas, Offset position, TextStyle style, int angle) {
        if (text == null || text!.isEmpty) {
          return;
        }
        final TextSpan span = TextSpan(text: text, style: style);
        final TextPainter textPainter = TextPainter(
          text: span,
          textAlign: TextAlign.center,
          textDirection: TextDirection.ltr,
        );
        textPainter.layout();
        if (angle == 0) {
          textPainter.paint(canvas, position);
        } else {
          final double halfWidth = textPainter.width / 2;
          final double halfHeight = textPainter.height / 2;
          canvas
            ..save()
            ..translate(position.dx + halfWidth, position.dy + halfHeight)
            ..rotate(degreesToRadians(angle.toDouble()));
          textPainter.paint(canvas, Offset(-halfWidth, -halfHeight));
          canvas.restore();
        }
      }

      double degreesToRadians(double deg) => deg * (pi / 180);
    }
Methods in tooltipBehavior
Show method in tooltipBehavior
The show method is used to activate the tooltip at the specified x and y point values.
late SfCartesianChart chart;
    late TooltipBehavior _tooltipBehavior;
    @override
    void initState(){
      _tooltipBehavior = TooltipBehavior(enable: true);
      super.initState();
    }

    @override
    Widget build(BuildContext context) {

      final List<ChartData> chartData = [
          ChartData(10, 17),
          ChartData(20, 34),
          // Add the required data
      ];
      chart = SfCartesianChart(
        tooltipBehavior: _tooltipBehavior,
          series: <CartesianSeries>[
            ColumnSeries<ChartData, double>(
              enableTooltip: true,
              dataSource: chartData,
              xValueMapper: (ChartData data, _) => data.x,
              yValueMapper: (ChartData data, _) => data.y)
        ]
      );

      return Scaffold(
        body: Center(
          child: Column(
            children: <Widget>[
              TextButton(
                child: Text('Show'),
                onPressed: show
              ),
              Container(child: chart)
            ]
          )
        )
      );
    }

    void show() {
        _tooltipBehavior.show(20, 34);
    }

    class ChartData {
        ChartData(this.x, this.y);
        final double x;
        final double? y;
      }
showByIndex method in tooltipBehavior
The showByIndex method is used to display the tooltip at the specified series and point index.
The below mentioned arguments are given to the showByIndex method:
-
seriesIndex- index of the series for which the pointIndex is specified. -
pointIndex- index of the point for which the tooltip should be shown.
late SfCartesianChart chart;
    late TooltipBehavior _tooltipBehavior;

    @override
    void initState(){
      _tooltipBehavior = TooltipBehavior(enable: true);
      super.initState();
    }

    @override
    Widget build(BuildContext context) {

      final List<ChartData> chartData = [
          ChartData(10, 17),
          ChartData(20, 34),
          // Add the required data
      ];
      chart = SfCartesianChart(
        tooltipBehavior: _tooltipBehavior,
          series: <CartesianSeries>[
            ColumnSeries<ChartData, double>(
              enableTooltip: true,
              dataSource: chartData,
              xValueMapper: (ChartData data, _) => data.x,
              yValueMapper: (ChartData data, _) => data.y)
        ]
      );

      return Scaffold(
        body: Center(
          child: Column(
            children: <Widget>[
              TextButton(
                child: Text('Show'),
                onPressed:(){
                    _tooltipBehavior.showByIndex(0,1);
                }
              ),
              Container(child: chart)
            ]
          )
        )
      );
    }

     class ChartData {
        ChartData(this.x, this.y);
        final double x;
        final double? y;
      }
showByPixel method in tooltipBehavior
The showByPixel method is used to display the tooltip at the specified x and y-positions.
x & y - logical pixel values to position the tooltip.
late SfCartesianChart chart;
    late TooltipBehavior _tooltipBehavior;

    @override
    void initState(){
      _tooltipBehavior = TooltipBehavior(enable: true);
      super.initState();
    }

    @override
    Widget build(BuildContext context) {

      final List<ChartData> chartData = [
          ChartData(10, 17),
          ChartData(20, 34),
          // Add the required data
      ];
      chart = SfCartesianChart(
        tooltipBehavior: _tooltipBehavior,
          series: <CartesianSeries>[
            ColumnSeries<ChartData, double>(
              enableTooltip: true,
              dataSource: chartData,
              xValueMapper: (ChartData data, _) => data.x,
              yValueMapper: (ChartData data, _) => data.y)
        ]
      );

      return Scaffold(
        body: Center(
          child: Column(
            children: <Widget>[
              TextButton(
                child: Text('Show'),
                onPressed:(){
                  _tooltipBehavior.showByPixel(230.0,470.0);
                }
              ),
              Container(child: chart)
            ]
          )
        )
      );
    }

     class ChartData {
        ChartData(this.x, this.y);
        final double x;
        final double? y;
      }
Hide method in tooltipBehavior
The hide method is used to hide the displaying tooltip programmatically.
late SfCartesianChart chart;
    late TooltipBehavior _tooltipBehavior;

    @override
    void initState(){
      _tooltipBehavior = TooltipBehavior(enable: true);
      super.initState();
    }

    @override
    Widget build(BuildContext context) {
      final List<ChartData> chartData = [
          ChartData(10, 17),
          ChartData(20, 34)
      // Add the required data
      ];
      chart = SfCartesianChart(
        tooltipBehavior: _tooltipBehavior,
        series: <CartesianSeries>[
          ColumnSeries<ChartData, double>(
              enableTooltip: true,
              dataSource: chartData,
              xValueMapper: (ChartData data, _) => data.x,
              yValueMapper: (ChartData data, _) => data.y)
          ]
      );

      return Scaffold(
        body: Center(
          child: Column(
            children: <Widget>[
              TextButton(
                child: Text('Hide'),
                onPressed: hide
              ),
              Container(child: chart)
            ]
          )
        )
      );
    }

    void hide(){
      _tooltipBehavior.hide();
    }

     class ChartData {
        ChartData(this.x, this.y);
        final double x;
        final double? y;
      }
Methods in trackballBehavior
Show method in trackballBehavior
The show method is used to activate the trackball at the specified location.
late SfCartesianChart chart;
  late TrackballBehavior _trackballBehavior;

  @override
  void initState() {
    _trackballBehavior = TrackballBehavior(enable: true);
    super.initState();
  }

  @override
  Widget build(BuildContext context) {

    final List<ChartData> chartData = [
      ChartData(10, 17),
      ChartData(20, 34)
      // Add the required data
    ];

    chart = SfCartesianChart(
        trackballBehavior: _trackballBehavior,
        series: <CartesianSeries>[
          ColumnSeries<ChartData, double>(
              enableTooltip: true,
              dataSource: chartData,
              xValueMapper: (ChartData data, _) => data.x,
              yValueMapper: (ChartData data, _) => data.y)
        ]);

    return Scaffold(
      body: Center(
        child: Column(
          children: <Widget>[
             TextButton(
              child: Text('Show'),
              onPressed: () {
                      _trackballBehavior.show(10, 17);
              }
             ),
             Container(child: chart)
          ]
        )
      )
    );
  }

    class ChartData {
        ChartData(this.x, this.y);
        final double x;
        final double? y;
      }
showByIndex method in trackballBehavior
The showByIndex method is used to activate the trackball at the specified point index.
The pointIndex specifies the index of the trackball point.
late SfCartesianChart chart;
    late TrackballBehavior _trackballBehavior;

    @override
    void initState(){
      _trackballBehavior = TrackballBehavior(enable: true);
      super.initState();
    }

    @override
    Widget build(BuildContext context) {

      final List<ChartData> chartData = [
        ChartData(10, 17),
        ChartData(20, 34)
        // Add the required data
      ];

      chart = SfCartesianChart(
        trackballBehavior: _trackballBehavior,
        series: <CartesianSeries>[
          ColumnSeries<ChartData, double>(
              enableTooltip: true,
              dataSource: chartData,
              xValueMapper: (ChartData data, _) => data.x,
              yValueMapper: (ChartData data, _) => data.y)
        ]
      );

      return Scaffold(
        body: Center(
          child: Column(
            children: <Widget>[
              TextButton(
                child: Text('Show'),
                onPressed: () {
                  _trackballBehavior.showByIndex(3);
                },
              ),
              Container(child: chart)
            ]
          )
        )
      );
    }

     class ChartData {
        ChartData(this.x, this.y);
        final double x;
        final double? y;
      }
Hide method in trackballBehavior
The hide method is used to hide the displaying trackball programmatically.
late SfCartesianChart chart;
    late TrackballBehavior _trackballBehavior;

    @override
    void initState(){
      _trackballBehavior = TrackballBehavior(enable: true);
      super.initState();
    }

    @override
    Widget build(BuildContext context) {

      final List<ChartData> chartData = [
        ChartData(10, 17),
        ChartData(20, 34),
        // Add the required data
      ];

      chart = SfCartesianChart(
        trackballBehavior: _trackballBehavior,
        series: <CartesianSeries>[
          ColumnSeries<ChartData, double>(
              enableTooltip: true,
              dataSource: chartData,
              xValueMapper: (ChartData data, _) => data.x,
              yValueMapper: (ChartData data, _) => data.y)
        ],
      );

      return Scaffold(
        body: Center(
          child: Column(
            children: <Widget>[
              TextButton(
                child: Text('Hide'),
                onPressed: hide
              ),
              Container(child: chart)
            ]
          )
        )
      );
    }

    void hide() {
        _trackballBehavior.hide();
    }

     class ChartData {
        ChartData(this.x, this.y);
        final double x;
        final double? y;
      }
Events in trackballBehavior
Provided the following methods for handling pointer and gesture events and allowing customizations for various pointer events such as long-press, tap, double-tap, pointer enter, and exit.
-
handleEvent- Specifies to customize the necessary pointer events. -
handleLongPressStart- Specifies to customize the pointer event when a long-press begins. -
handleLongPressMoveUpdate- Specifies to customize the pointer event during movement after a long-press. -
handleLongPressEnd- Specifies to customize the pointer event when the pointer stops contacting the screen after a long-press. -
handleTapDown- Specifies to customize the pointer event when a tap has contacted the screen once. -
handleTapUp- Specifies to customize the pointer event when it has stopped contacting the screen after a tap. -
handleDoubleTap- Specifies to customize the pointer event when a tap has contacted the screen twice. -
handlePointerEnter-Specifies to customize the pointer event when the mouse enter on the screen. -
handlePointerExit- Specifies to customize the pointer event when the mouse exit on the screen.
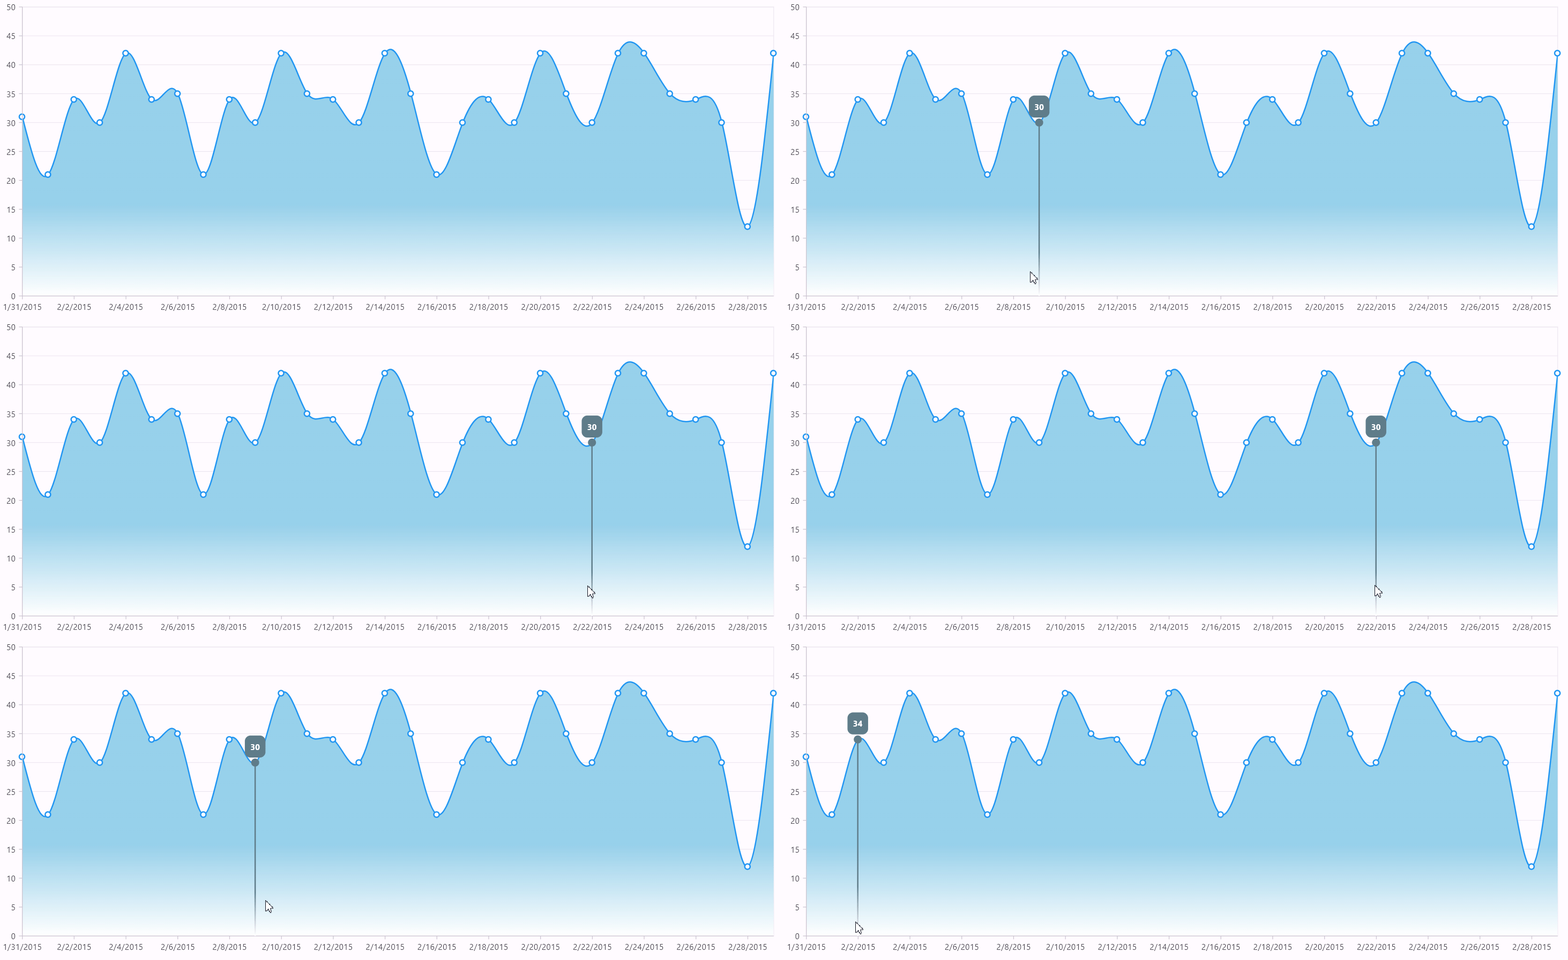
This following code sample defines how to enable or disable specific pointer events and customize to show trackball in double tap and disabled trackball showing in pointer enter and exit.
SfCartesianChart(
      trackballBehavior: CustomTrackball(),
      // Add series.
    );

    class CustomTrackball extends TrackballBehavior {
      @override
      bool get enable => true;

      // Disable the behavior of pointer events(move, cancel, hover and up).
      @override
      void handleEvent(PointerEvent event, BoxHitTestEntry entry) {}

      // Disable the behavior of the pointer enter on the screen.
      @override
      void handlePointerEnter(PointerEnterEvent details) {}

      // Disable the behavior of the pointer exit on the screen.
      @override
      void handlePointerExit(PointerExitEvent details) {}

      @override
      void handleDoubleTap(Offset position) {
        if (activationMode == ActivationMode.doubleTap) {
          Offset localPosition = parentBox!.globalToLocal(position);
          show(localPosition.dx, localPosition.dy, 'pixel');
        }
      }
    }
onPaint in trackballBehavior
The onPaint method is used to customize the label, position, and style of trackball tooltip.
SfCartesianChart(
      trackballBehavior: CustomTrackball(),
      // Add series.
    );

    class CustomTrackball extends TrackballBehavior {
      @override
      bool get enable => true;

      @override
      ActivationMode get activationMode => ActivationMode.singleTap;

      Offset? customPosition;

      @override
      void show(x, double y, [String coordinateUnit = 'point']) {
        if (coordinateUnit == 'pixel') {
          customPosition = Offset(x.toDouble(), y);
        }
        super.show(x, y, 'pixel');
      }

      @override
      void onPaint(PaintingContext context, Offset offset,
      SfChartThemeData chartThemeData, ThemeData themeData) {
        _drawCustomTrackballLine(context, offset, chartThemeData, themeData);
        TextStyle style = TextStyle(
          color: Colors.white,
          fontSize: 12,
          fontWeight: FontWeight.bold,
          background: Paint()
            ..color = Colors.blueGrey
            ..strokeWidth = 17
            ..strokeJoin = StrokeJoin.round
            ..strokeCap = StrokeCap.round
            ..style = PaintingStyle.stroke,
          );

        if (chartPointInfo.isNotEmpty) {
          _drawText(
            context.canvas,
            chartPointInfo[0].label!,
            Offset(chartPointInfo[0].xPosition!, chartPointInfo[0].yPosition!),
            style);
        }
      }

      void _drawCustomTrackballLine(PaintingContext context, Offset offset, SfChartThemeData chartThemeData, ThemeData themeData) {
        if (chartPointInfo.isNotEmpty && lineType != TrackballLineType.none) {
          final Rect plotAreaBounds = parentBox!.paintBounds;
          final double x = chartPointInfo[0].xPosition!;
          final Offset start = Offset(x, chartPointInfo[0].yPosition!);
          final Offset end = Offset(x, plotAreaBounds.bottom);
          final Paint paint = Paint()
            ..isAntiAlias = true
            ..color = Colors.red
            ..strokeWidth = 2
            ..style = PaintingStyle.stroke
            ..shader = ui.Gradient.linear(
              start,
              end,
              <Color>[Colors.blueGrey, Colors.white],
              <double>[0.75, 1],
            );

          context.canvas.drawLine(end, start, paint);
          context.canvas.drawCircle(start, 5,
              Paint()
                ..color = Colors.blueGrey
                ..style = PaintingStyle.fill);
          context.canvas.drawCircle(start, 5,
              Paint()
                ..color = Colors.blueGrey
                ..strokeWidth = 2.0
                ..style = PaintingStyle.stroke
                ..isAntiAlias = true);
        }
      }

      void _drawText(Canvas canvas, String text, Offset point,  TextStyle style) {
        final TextPainter tp = TextPainter(
          text: TextSpan(text: text, style: style),
          textDirection: TextDirection.ltr,
          textAlign: TextAlign.center,
          maxLines: getMaxLinesContent(text),
        );

        tp.layout();
        canvas.save();
        canvas.translate(point.dx - tp.width / 2, point.dy - (tp.height * 2));
        Offset labelOffset = Offset.zero;
        tp.paint(canvas, labelOffset);
        canvas.restore();
      }
    }
Methods in crosshairBehavior
Show method in crosshairBehavior
The show method is used to activate the crosshair at the specified location.
late SfCartesianChart chart;
    late CrosshairBehavior _crosshairBehavior;

    @override
    void initState(){
      _crosshairBehavior = CrosshairBehavior(enable: true);
      super.initState();
    }

    @override
    Widget build(BuildContext context) {
      // Add the required data
      final List<ChartData> chartData = [
        ChartData(10, 17),
        ChartData(20, 34),
      ];

      chart = SfCartesianChart(
        crosshairBehavior: _crosshairBehavior,
        series: <CartesianSeries>[
          ColumnSeries<ChartData, double>(
              enableTooltip: true,
              dataSource: chartData,
              xValueMapper: (ChartData data, _) => data.x,
              yValueMapper: (ChartData data, _) => data.y
            )
        ]
      );

      return Scaffold(
        body: Center(
          child: Column(
            children: <Widget>[
              TextButton(
                child: Text('Show'),
                onPressed: ()
                {
                  _crosshairBehavior.show(121, 164);
                }
              ),
              Container(child: chart)
            ]
          )
        )
      );
    }

     class ChartData {
        ChartData(this.x, this.y);
        final double x;
        final double? y;
      }
showByIndex method in crosshairBehavior
The showByIndex method is used to activate the crosshair at the specified point index.
pointIndex - index of point at which the crosshair needs to be shown.
late SfCartesianChart chart;
    late CrosshairBehavior _crosshairBehavior;

    @override
    void initState(){
      _crosshairBehavior = CrosshairBehavior(enable: true);
      super.initState();
    }

    @override
    Widget build(BuildContext context) {
      // Add the required data
      final List<ChartData> chartData = [
        ChartData(10, 17),
        ChartData(20, 34),
      ];
      chart = SfCartesianChart(
        crosshairBehavior: _crosshairBehavior,
        series: <CartesianSeries>[
          ColumnSeries<ChartData, double>(
              enableTooltip: true,
              dataSource: chartData,
              xValueMapper: (ChartData data, _) => data.x,
              yValueMapper: (ChartData data, _) => data.y
            )
        ]
      );

      return Scaffold(
        body: Center(
          child: Column(
            children: <Widget>[
              TextButton(
                child: Text('Show'),
                onPressed: ()
                {
                  _crosshairBehavior.showByIndex(2);
                }
              ),
              Container(child: chart)
            ]
          )
        )
      );
    }

     class ChartData {
        ChartData(this.x, this.y);
        final double x;
        final double? y;
      }
Hide method in crosshairBehavior
The hide method is used to hide the displaying crosshair programmatically.
late SfCartesianChart chart;
    late CrosshairBehavior _crosshairBehavior;

    @override
    void initState(){
      _crosshairBehavior = CrosshairBehavior(enable: true);
      super.initState();
    }

    @override
    Widget build(BuildContext context) {
      final List<ChartData> chartData = [
        ChartData(10, 17),
        ChartData(20, 34)
      // Add the required data
      ];
      chart = SfCartesianChart(
        crosshairBehavior: _crosshairBehavior,
        series: <CartesianSeries>[
          ColumnSeries<ChartData, double>(
              enableTooltip: true,
              dataSource: chartData,
              xValueMapper: (ChartData data, _) => data.x,
              yValueMapper: (ChartData data, _) => data.y)
        ]
      );

      return Scaffold(
        body: Center(
          child: Column(
            children: <Widget>[
              TextButton(
                child: Text('Hide'),
                onPressed: hide
              ),
              Container(child: chart)
            ]
          )
        )
      );
    }

    void hide() {
        _crosshairBehavior.hide();
    }

     class ChartData {
        ChartData(this.x, this.y);
        final double x;
        final double? y;
      }
Events in crosshairBehavior
Provided the following methods for handling pointer and gesture events and allowing customizations for various pointer events such as long-press, tap, double-tap, pointer enter, and exit.
-
handleEvent- Specifies to customize the necessary pointer events. -
handleLongPressStart- Specifies to customize the pointer event when a long-press begins. -
handleLongPressMoveUpdate- Specifies to customize the pointer event during movement after a long-press. -
handleLongPressEnd- Specifies to customize the pointer event when the pointer stops contacting the screen after a long-press. -
handleTapDown- Specifies to customize the pointer event when a tap has contacted the screen once. -
handleTapUp- Specifies to customize the pointer event when it has stopped contacting the screen after a tap. -
handleDoubleTap- Specifies to customize the pointer event when a tap has contacted the screen twice. -
handlePointerEnter-Specifies to customize the pointer event when the mouse enter on the screen. -
handlePointerExit- Specifies to customize the pointer event when the mouse exit on the screen.
This following code sample defines how to enable or disable specific pointer events and customize to show crosshair in double tap and disabled crosshair showing in pointer enter and exit.
SfCartesianChart(
      crosshairBehavior: CustomCrosshair(),
      // Add series.
    );

    class CustomCrosshair extends CrosshairBehavior {
      @override
      bool get enable => true;

      // Disable the behavior of pointer events(move, cancel, hover and up).
      @override
      void handleEvent(PointerEvent event, BoxHitTestEntry entry) {}

      // Disable the behavior of the pointer enter on the screen.
      @override
      void handlePointerEnter(PointerEnterEvent details) {}

      // Disable the behavior of the pointer exit on the screen.
      @override
      void handlePointerExit(PointerExitEvent details) {}

      @override
      void handleDoubleTap(Offset position) {
        if (activationMode == ActivationMode.doubleTap) {
          Offset localPosition = parentBox!.globalToLocal(position);
          show(localPosition.dx, localPosition.dy, 'pixel');
        }
      }
    }
DrawVerticalAxisLine method in crosshairBehavior
The drawVerticalAxisLine method is used to customize the stroke drawing and styling of vertical crosshair line.
-
context- Specifies the painting context. -
offset- Specifies the crosshair position. -
dashArray- Specifies the crosshairlineDashArray. -
strokePaint- Specifies the crosshair line stroke paint.
class CustomCrosshair extends CrosshairBehavior {
      @override
      void drawVerticalAxisLine(PaintingContext context, Offset offset,
        List<double>? dashArray, Paint strokePaint) {
        strokePaint
          ..isAntiAlias = true
          ..color = Colors.green
          ..strokeWidth = 1;
        dashArray = [5, 10, 5];
        super.drawVerticalAxisLine(context, offset, dashArray, strokePaint);
      }
    }
DrawHorizontalAxisLine method in crosshairBehavior
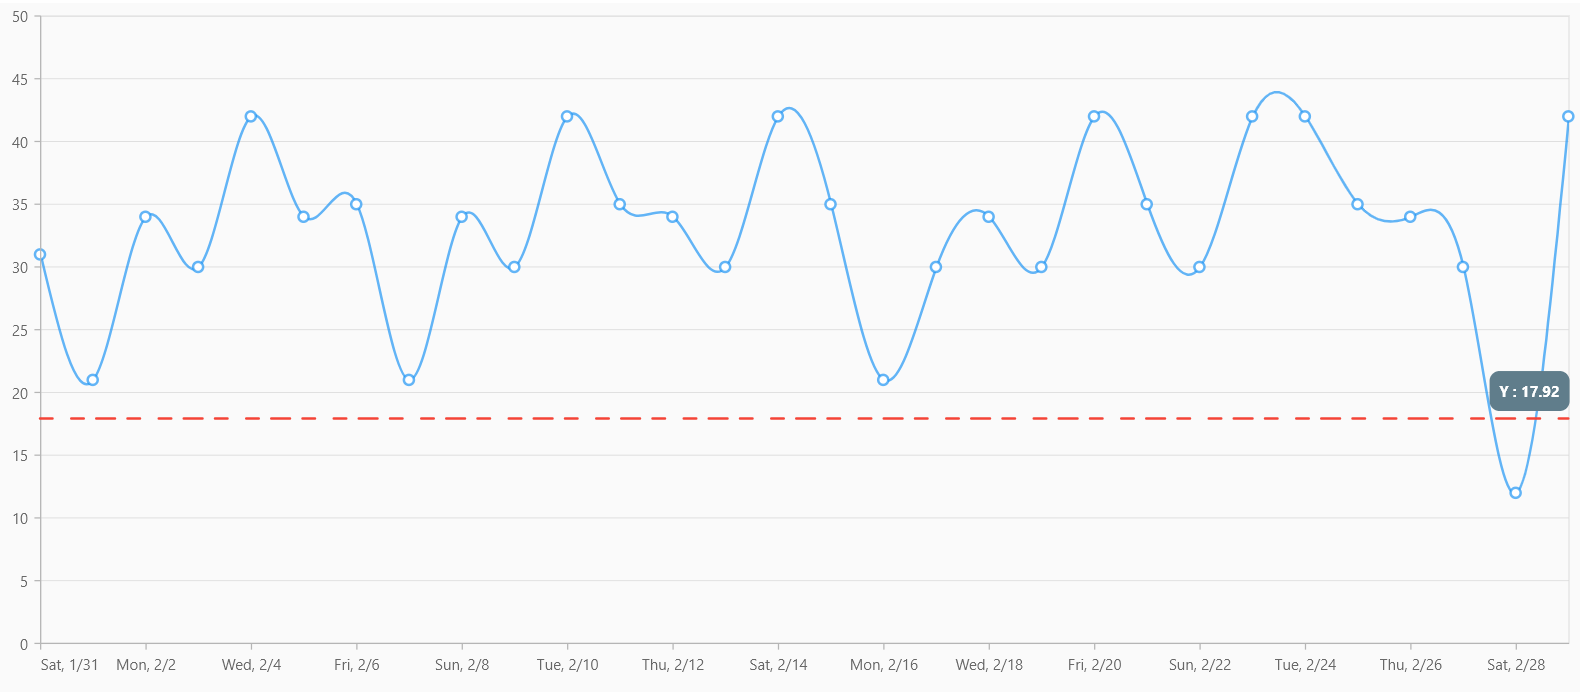
The drawHorizontalAxisLine method is used to customize the stroke drawing and styling of horizontal crosshair line.
class CustomCrosshair extends CrosshairBehavior {
      @override
      void drawHorizontalAxisLine(PaintingContext context, Offset offset, List<double>? dashArray, Paint strokePaint) {
        strokePaint
          ..isAntiAlias = true
          ..strokeCap = StrokeCap.round
          ..color = Colors.red
          ..strokeWidth = 2;
        dashArray = [10, 15, 10];
        super.drawHorizontalAxisLine(context, offset, dashArray, strokePaint);
      }
    }
DrawHorizontalAxisTooltip method in crosshairBehavior
The drawHorizontalAxisTooltip method is used to customize the tooltip label, position, and style for horizontal axis tooltip.
-
context- Specifies the painting context. -
position- Specifies the position of the tooltip label. -
text- Specifies the tooltip label. -
style- Specifies the style of the tooltip text. -
path- Specifies path reference of the tooltip rectangle. -
fillPaint- Specifies the fill paint applied to the default tooltip rectangle. -
strokePaint- Specifies the stroke paint applied to the default tooltip rectangle.
class CustomCrosshair extends CrosshairBehavior {
      Offset? customPosition;

      @override
      void show(x, double y, [String coordinateUnit = 'point']) {
        if (coordinateUnit == 'pixel') {
          customPosition = Offset(x.toDouble(), y);
        }
        super.show(x, y, 'pixel');
      }

      @override
      void drawHorizontalAxisTooltip(PaintingContext context, Offset position, String text, TextStyle style, [Path? path, Paint? fillPaint, Paint? strokePaint]) {
        TextStyle style = TextStyle(
        color: Colors.white,
        fontSize: 12,
        background: Paint()
          ..color = Colors.blueGrey
          ..strokeWidth = 16
          ..strokeJoin = StrokeJoin.round
          ..style = dart_ui.PaintingStyle.stroke,
        );

        if (parentBox != null) {
        final Rect bounds = parentBox!.paintBounds;
        final String finalText = 'Y : ${verticalValue.toStringAsFixed(2)}';
        final Offset horizontalPosition =
            Offset(bounds.right, customPosition!.dy).translate(-50, -20);
        _drawText(context.canvas, finalText, horizontalPosition, style);
      }
    }

      void _drawText(Canvas canvas, String text, Offset point, TextStyle style) {
        final TextPainter textPainter = TextPainter(
          text: TextSpan(
            text: text,
            style: style.copyWith(fontWeight: dart_ui.FontWeight.bold)),
        textDirection: dart_ui.TextDirection.ltr,
        textAlign: TextAlign.center,
        maxLines: getMaxLinesContent(text),
        );

        textPainter
        ..layout()
        ..paint(canvas, point);
      }
    }
DrawVerticalAxisTooltip method in crosshairBehavior
The drawVerticalAxisTooltip method is used to customize the tooltip label, position, and style for vertical axis tooltip.
For further reference, please consult the drawHorizontalAxisTooltip code sample.
onPaint in crosshairBehavior
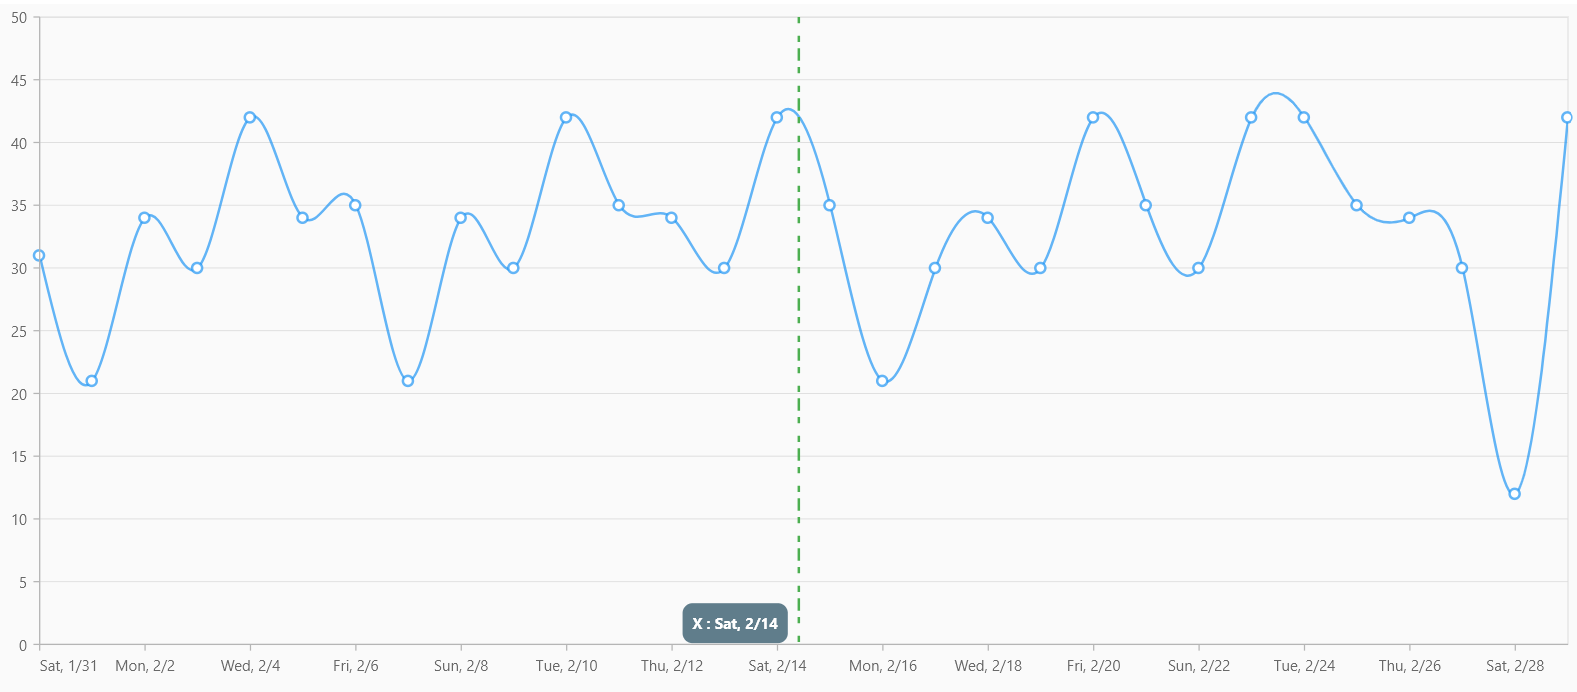
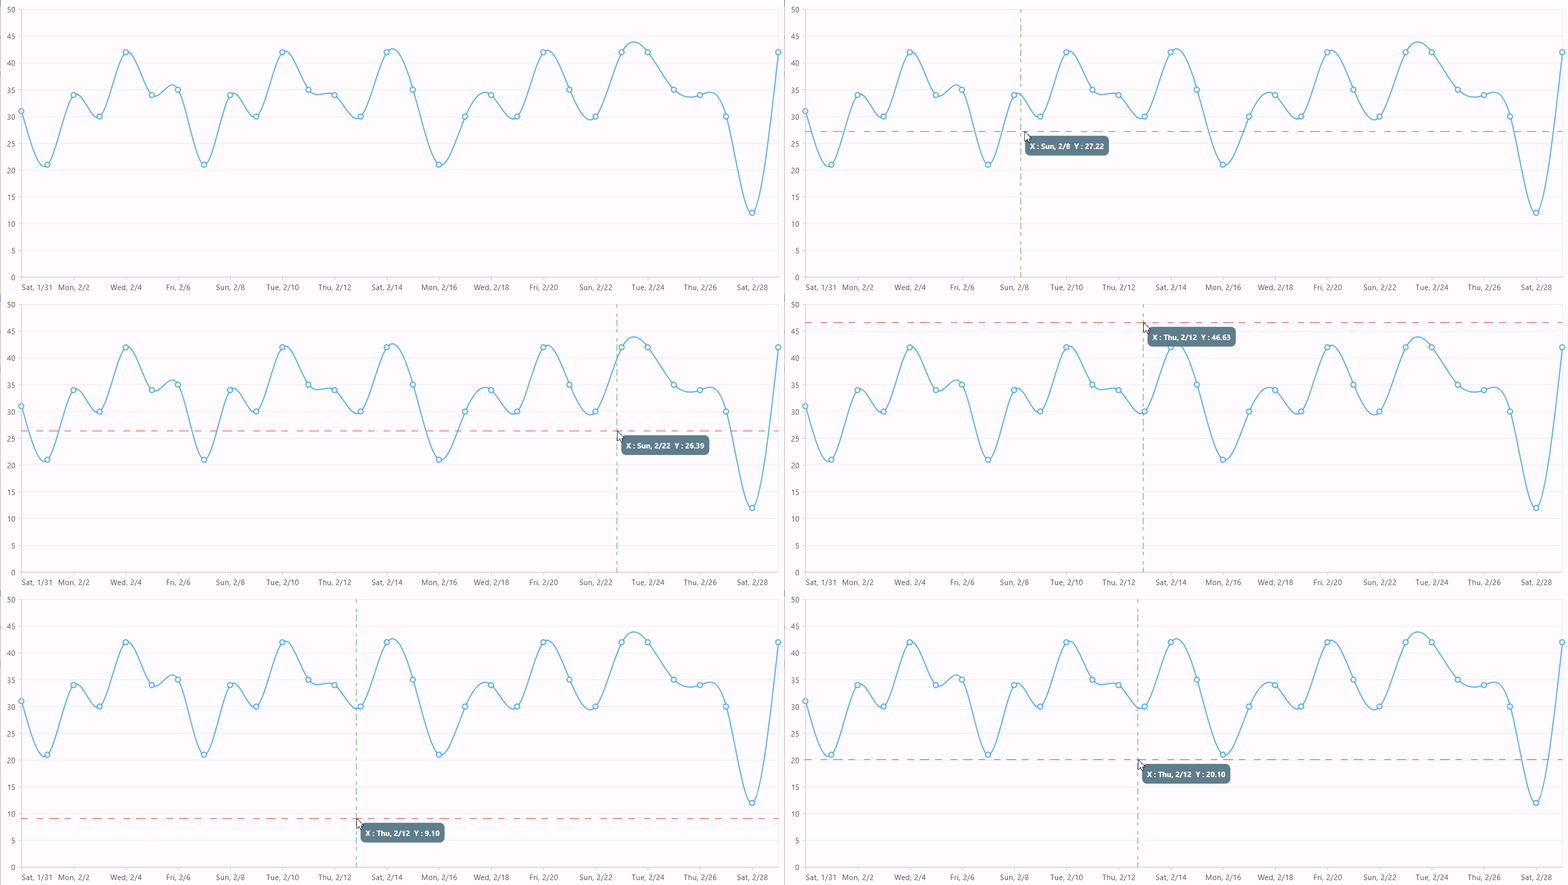
The onPaint method is used to customize the label, position, and style of crosshair tooltip.
dynamic verticalValue;
    late String horizontalText;

    @override
    void initState() {
      verticalValue = null;
      horizontalText = '';
      super.initState();
    }

    @override
    Widget build(BuildContext context) {
      final List<_SalesData> dateTimeData = [
        _SalesData(DateTime(2015, 2, 0), 31),
        _SalesData(DateTime(2015, 2, 1), 21),
        // Add data points.
      ];
      return Scaffold(
        body: SfCartesianChart(
          crosshairBehavior: CustomCrosshair(),
          onCrosshairPositionChanging: (CrosshairRenderArgs args) {
            if (args.orientation != null) {
              if (args.orientation == AxisOrientation.horizontal) {
                horizontalText = args.text;
              }
              if (args.orientation == AxisOrientation.vertical) {
                verticalValue = args.value;
              }
            }
          },
          series: <CartesianSeries<_SalesData, DateTime>>[
            SplineSeries(
              dataSource: dateTimeData,
              xValueMapper: (_SalesData sales, _) => sales.x,
              yValueMapper: (_SalesData sales, _) => sales.y,
              markerSettings: MarkerSettings(isVisible: true),
            ),
          ],
        ),
      );
    }


    class _SalesData {
      _SalesData(this.x, this.y);
      final dynamic x;
      final double y;
    }

    class CustomCrosshair extends CrosshairBehavior {
      @override
      bool get enable => true;

      Offset? customPosition;

      @override
      void show(x, double y, [String coordinateUnit = 'point']) {
        if (coordinateUnit == 'pixel') {
          customPosition = Offset(x.toDouble(), y);
        }
        super.show(x, y, 'pixel');
      }

      @override
      void drawHorizontalAxisLine(PaintingContext context, Offset offset, List<double>? dashArray, Paint strokePaint) {
        strokePaint
          ..isAntiAlias = true
          ..strokeCap = StrokeCap.round
          ..color = Colors.red
          ..strokeWidth = 2;
        dashArray = [10, 15, 10];
        super.drawHorizontalAxisLine(context, offset, dashArray, strokePaint);
      }

      @override
      void drawVerticalAxisLine(PaintingContext context, Offset offset, List<double>? dashArray, Paint strokePaint) {
        strokePaint
          ..isAntiAlias = true
          ..strokeCap = StrokeCap.round
          ..color = Colors.green
          ..strokeWidth = 2;
        dashArray = [5, 10, 5];
        super.drawVerticalAxisLine(context, offset, dashArray, strokePaint);
      }

      @override
      void drawVerticalAxisTooltip(
      PaintingContext context, Offset position, String text, TextStyle style, [Path? path, Paint? fillPaint, Paint? strokePaint]) {
        // Don't invoke default tooltip.
      }

      @override
      void drawHorizontalAxisTooltip(
      PaintingContext context, Offset position, String text, TextStyle style, [Path? path, Paint? fillPaint, Paint? strokePaint]) {
        // Don't invoke default tooltip.
      }

      @override
      void onPaint(PaintingContext context, Offset offset, SfChartThemeData chartThemeData, ThemeData themeData) {
        super.onPaint(context, offset, chartThemeData, themeData);
        // Custom tooltip.
        TextStyle style = TextStyle(
          color: Colors.white,
          fontSize: 12,
          background: Paint()
            ..color = Colors.blueGrey
            ..strokeWidth = 16
            ..strokeJoin = StrokeJoin.round
            ..style = dart_ui.PaintingStyle.stroke,
        );

        if (customPosition != null && horizontalText != '' && verticalValue != null) {
          final String finalText = 'X : ${horizontalText}  Y : ${verticalValue.toStringAsFixed(2)}';
          _drawText( context.canvas, finalText, customPosition!.translate(20, 20), style);
        }
      }

      void _drawText(Canvas canvas, String text, Offset point, TextStyle style) {
        final TextPainter textPainter = TextPainter(
          text: TextSpan(
            text: text,
            style: style.copyWith(fontWeight: dart_ui.FontWeight.bold)),
          textAlign: TextAlign.center,
          textDirection: dart_ui.TextDirection.ltr,
        );
        textPainter
          ..layout()
          ..paint(canvas, point);
      }

      @override
      void hide() {
        customPosition = null;
        horizontalText = '';
        verticalValue = null;
        super.hide();
      }
    }
Methods in selectionBehavior
SelectDataPoints method in selectionBehavior
The selectDataPoints method is used to select the data point programmatically. The required arguments are listed below.
-
pointIndex- index of the point which needs to be selected. -
seriesIndex- index of the series for which the pointIndex is specified and this is an optional argument. By default it will be considered as 0.
Note: The
enableMultiSelectionandselectionTypeare also applicable for this but, it is based on their API values specified in the chart.
late SfCartesianChart chart;
    late SelectionBehavior _selectionBehavior;

    @override
    void initState(){
      _selectionBehavior = SelectionBehavior(enable: true);
      super.initState();
    }

    @override
    Widget build(BuildContext context) {

      final List<ChartData> chartData = [
        ChartData(10, 17),
        ChartData(20, 34)
        // Add the required data
      ];

      chart = SfCartesianChart(
        series: <CartesianSeries>[
          ColumnSeries<ChartData, double>(
              dataSource: chartData,
              xValueMapper: (ChartData data, _) => data.x,
              yValueMapper: (ChartData data, _) => data.y,
              selectionBehavior: _selectionBehavior
          )
        ]
      );

      return Scaffold(
        body: Center(
          child: Column(
            children: <Widget>[
              TextButton(
                child: Text('Select'),
                onPressed: select
              ),
              Container(child: chart)
            ]
          )
        )
      );
    }

    void select() {
        _selectionBehavior.selectDataPoints(1, 0);
    }

     class ChartData {
        ChartData(this.x, this.y);
        final double x;
        final double? y;
      }
Methods in zoomPanBehavior
ZoomIn method in zoomPanBehavior
The zoomIn method is used to increase the magnification of the plot area.
late SfCartesianChart chart;
    late ZoomPanBehavior _zoomPanBehavior;

    @override
    void initState(){
      _zoomPanBehavior =  ZoomPanBehavior(
        enableSelectionZooming: true,
        enableDoubleTapZooming: true,
        enablePinching: true,
        enablePanning: true
      );
      super.initState();
    }

    @override
    Widget build(BuildContext context) {
      final List<ChartData> chartData = [
        ChartData(10, 17),
        ChartData(20, 34)
        //add the required data
      ];

      chart = SfCartesianChart(
        zoomPanBehavior: _zoomPanBehavior,
        series: <CartesianSeries>[
          ColumnSeries<ChartData, double>(
            dataSource: chartData,
            xValueMapper: (ChartData data, _) => data.x,
            yValueMapper: (ChartData data, _) => data.y
          )
        ]
      );

      return Scaffold(
        body: Center(
          child: Column(
            children: <Widget>[
              TextButton(
                child: Text('Zoom'),
                onPressed: zoom
              ),
              Container(child: chart)
            ]
          )
        )
      );
    }

    void zoom() {
        _zoomPanBehavior.zoomIn();
    }

     class ChartData {
        ChartData(this.x, this.y);
        final double x;
        final double? y;
      }
ZoomOut method in zoomPanBehavior
The zoomOut method is used to decrease the magnification of the plot area.
late SfCartesianChart chart;
    late ZoomPanBehavior _zoomPanBehavior;

    @override
    void initState(){
      _zoomPanBehavior =  ZoomPanBehavior(
        enableSelectionZooming: true,
        enableDoubleTapZooming: true,
        enablePinching: true,
        enablePanning: true
      );
      super.initState();
    }

    @override
    Widget build(BuildContext context) {

      final List<ChartData> chartData = [
        ChartData(10, 17),
        ChartData(20, 34)
        //add the required data
      ];

      chart = SfCartesianChart(
        zoomPanBehavior: _zoomPanBehavior,
        series: <CartesianSeries>[
          ColumnSeries<ChartData, double>(
            dataSource: chartData,
            xValueMapper: (ChartData data, _) => data.x,
            yValueMapper: (ChartData data, _) => data.y
          )
        ]
      );

      return Scaffold(
        body: Center(
          child: Column(
            children: <Widget>[
              TextButton(
                child: Text('Zoom'),
                onPressed: zoom
              ),
              Container(child: chart)
            ]
          )
        )
      );
    }

    void zoom() {
        _zoomPanBehavior.zoomOut();
    }

     class ChartData {
        ChartData(this.x, this.y);
        final double x;
        final double? y;
      }
zoomByFactor method in zoomPanBehavior
The zoomByFactor method changes the zoom level using zoom factor. Here, you can pass the zoom factor of an axis to magnify the plot area. The value ranges from 0 to 1.
late SfCartesianChart chart;
    late ZoomPanBehavior _zoomPanBehavior;

    @override
    void initState(){
      _zoomPanBehavior =  ZoomPanBehavior(
        enableSelectionZooming: true,
        enableDoubleTapZooming: true,
        enablePinching: true,
        enablePanning: true
      );
      super.initState();
    }

    @override
    Widget build(BuildContext context) {

      final List<ChartData> chartData = [
        ChartData(10, 17),
        ChartData(20, 34),
        //add the required data
      ];
      chart = SfCartesianChart(
        zoomPanBehavior: _zoomPanBehavior,
        series: <CartesianSeries>[
          ColumnSeries<ChartData, double>(
            dataSource: chartData,
            xValueMapper: (ChartData data, _) => data.x,
            yValueMapper: (ChartData data, _) => data.y
          )
        ]
      );

      return Scaffold(
        body: Center(
          child: Column(
            children: <Widget>[
              TextButton(
                child: Text('Zoom'),
                onPressed: zoom
              ),
              Container(child: chart)
            ]
          )
        )
      );
    }

    void zoom() {
        _zoomPanBehavior.zoomByFactor(0.5);
    }

     class ChartData {
        ChartData(this.x, this.y);
        final double x;
        final double? y;
      }
ZoomByRect method in zoomPanBehavior
The zoomByRect method zooms the chart for a given rectangle value. Here, you can pass the rectangle with the left, right, top, and bottom values, using which the selection zooming will be performed.
late SfCartesianChart chart;
    late ZoomPanBehavior _zoomPanBehavior;

    @override
    void initState(){
      _zoomPanBehavior =  ZoomPanBehavior(
        enableSelectionZooming: true,
        enableDoubleTapZooming: true,
        enablePinching: true,
        enablePanning: true
      );
      super.initState();
    }

    @override
    Widget build(BuildContext context) {

      final List<ChartData> chartData = [
        ChartData(10, 17),
        ChartData(20, 34),
        //add the required data
      ];

      chart = SfCartesianChart(
        zoomPanBehavior: _zoomPanBehavior,
        series: <CartesianSeries>[
          ColumnSeries<ChartData, double>(
            dataSource: chartData,
            xValueMapper: (ChartData data, _) => data.x,
            yValueMapper: (ChartData data, _) => data.y
          )
        ]
      );

      return Scaffold(
        body: Center(
          child: Column(
            children: <Widget>[
              TextButton(
                child: Text('Zoom'),
                onPressed: zoom
              ),
              Container(child: chart)
            ]
          )
        )
      );
    }

    void zoom() {
        _zoomPanBehavior.zoomByRect(const Rect.fromLTRB(200, 300, 300, 400));
    }

     class ChartData {
        ChartData(this.x, this.y);
        final double x;
        final double? y;
      }
ZoomToSingleAxis method in zoomPanBehavior
The zoomToSingleAxis method changes the zoom level of an appropriate axis. Here, you need to pass axis, zoom factor, zoom position of the zoom level that needs to be modified.
late SfCartesianChart chart;
    late ZoomPanBehavior _zoomPanBehavior;

    @override
    void initState(){
      _zoomPanBehavior =  ZoomPanBehavior(
        enableSelectionZooming: true,
        enableDoubleTapZooming: true,
        enablePinching: true,
        enablePanning: true
      );
      super.initState();
    }

    late NumericAxis xAxis;

    @override
    Widget build(BuildContext context) {

      final List<ChartData> chartData = [
        ChartData(10, 17),
        ChartData(20, 34),
        //add required data
      ];
      xAxis = NumericAxis();
      chart = SfCartesianChart(
        zoomPanBehavior: _zoomPanBehavior,
        primaryXAxis: xAxis,
        series: <CartesianSeries>[
          ColumnSeries<ChartData, double>(
            dataSource: chartData,
            xValueMapper: (ChartData data, _) => data.x,
            yValueMapper: (ChartData data, _) => data.y
          )
        ]
      );

      return Scaffold(
        body: Center(
          child: Column(
            children: <Widget>[
              TextButton(
                child: Text('Zoom'),
                onPressed: zoom
              ),
              Container(child: chart)
            ]
          )
        )
      );
    }

    void zoom() {
        final double zoomPosition = 0.5;
        final double zoomFactor = 0.4;
        _zoomPanBehavior.zoomToSingleAxis(xAxis,zoomPosition,zoomFactor);
    }

     class ChartData {
        ChartData(this.x, this.y);
        final double x;
        final double? y;
      }
PanToDirection method in zoomPanBehavior
The panToDirection method pans the plot area for given left, right, top, and bottom directions. To perform this action, the plot area needs to be in zoomed state.
late SfCartesianChart chart;
    late NumericAxis xAxis;
    late ZoomPanBehavior _zoomPanBehavior;

    @override
    void initState(){
      _zoomPanBehavior =  ZoomPanBehavior(
        enableSelectionZooming: true,
        enableDoubleTapZooming: true,
        enablePinching: true,
        enablePanning: true
      );
      super.initState();
    }

    @override
    Widget build(BuildContext context) {

      final List<ChartData> chartData = [
        ChartData(10, 17),
        ChartData(20, 34),
        //add required data
      ];

      xAxis = NumericAxis();
      chart = SfCartesianChart(
        zoomPanBehavior: _zoomPanBehavior,
        primaryXAxis: xAxis,
        series: <CartesianSeries>[
          ColumnSeries<ChartData, double>(
            dataSource: chartData,
            xValueMapper: (ChartData data, _) => data.x,
            yValueMapper: (ChartData data, _) => data.y
          )
        ]
      );

      return Scaffold(
        body: Center(
          child: Column(
            children: <Widget>[
              TextButton(
                child: Text('Pan'),
                onPressed: pan
              ),
              Container(child: chart)
            ]
          )
        )
      );
    }

    void pan() {
        //In similar way, specify other directions like bottom, left and right
        _zoomPanBehavior.panToDirection('top');
    }

     class ChartData {
        ChartData(this.x, this.y);
        final double x;
        final double? y;
      }
Reset method in zoomPanBehavior
The reset method returns the plot area back to its original position after zooming..
late SfCartesianChart chart;
    late ZoomPanBehavior _zoomPanBehavior;

    @override
    void initState(){
      _zoomPanBehavior =  ZoomPanBehavior(
        enableSelectionZooming: true,
        enableDoubleTapZooming: true,
        enablePinching: true,
        enablePanning: true
      );
      super.initState();
    }

    @override
    Widget build(BuildContext context) {

      final List<ChartData> chartData = [
        ChartData(10, 17),
        ChartData(20, 34)
        //add the required data
      ];

      chart = SfCartesianChart(
        zoomPanBehavior: _zoomPanBehavior,
        series: <CartesianSeries>[
          ColumnSeries<ChartData, double>(
            dataSource: chartData,
            xValueMapper: (ChartData data, _) => data.x,
            yValueMapper: (ChartData data, _) => data.y
          )
        ]
      );

      return Scaffold(
        body: Center(
          child: Column(
            children: <Widget>[
              TextButton(
                child: Text('Zoom'),
                onPressed: zoom
              ),
              Container(child: chart)
            ]
          )
        )
      );
    }

    void zoom() {
      _zoomPanBehavior.reset();
    }

     class ChartData {
        ChartData(this.x, this.y);
        final double x;
        final double? y;
      }
Events in zoomPanBehavior
Provided the following methods for handling pointer and gesture events and allowing customizations for various pointer events such as double-tap, scale and long-press.
-
handleEvent- Specifies to customize the necessary pointer events. -
handleDoubleTap- Specifies to customize the pointer event when a tap has contacted the screen twice. -
handleScaleStart- Specifies to customize the pointer event when the pointers begins to move. -
handleScaleUpdate- Specifies to customize the pointer event when the pointers in the moving state. -
handleScaleEnd- Specifies to customize the pointer event when the pointers stops moving and contacting on the screen. -
handleLongPressStart- Specifies to customize the pointer event when a long-press begins. -
handleLongPressMoveUpdate- Specifies to customize the pointer event during movement after a long-press. -
handleLongPressEnd- Specifies to customize the pointer event when the pointer stops contacting the screen after a long-press.
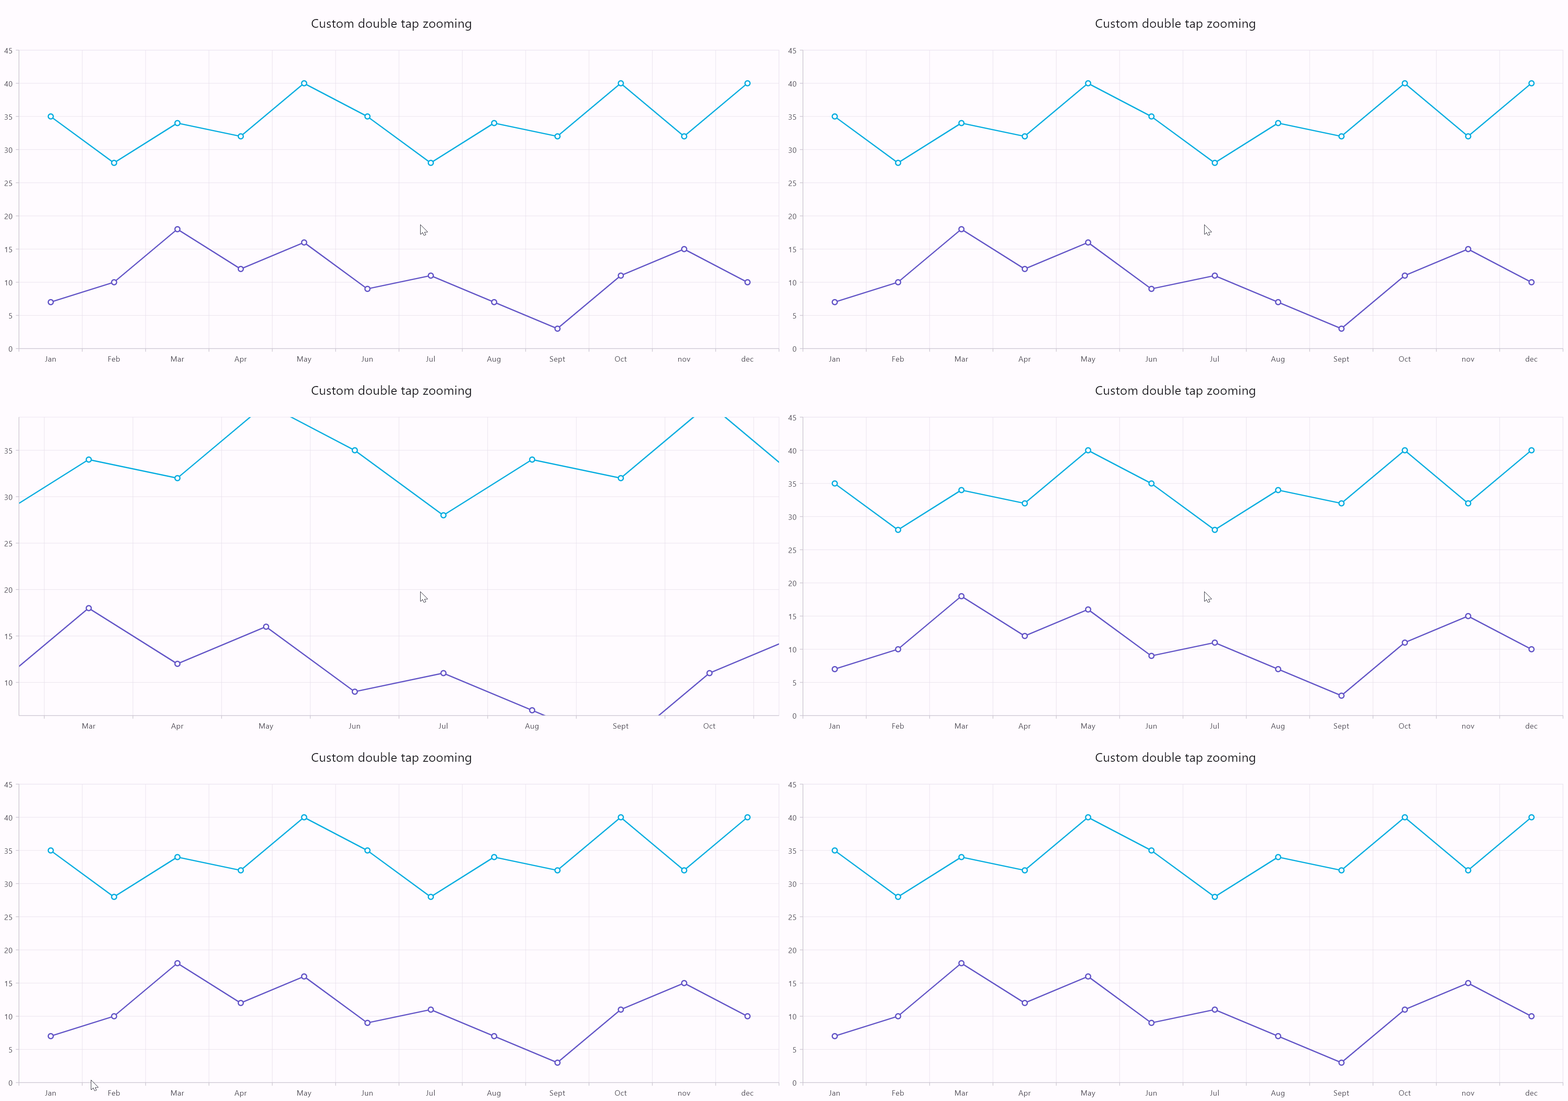
This following code sample defines how to perform zoom in and out behavior in double tap zooming.
CategoryAxis xAxis = CategoryAxis();
    NumericAxis yAxis = NumericAxis();

    SfCartesianChart(
      primaryXAxis: xAxis,
      primaryYAxis: yAxis,
      zoomPanBehavior: CustomDoubleTapZoomPanBehavior(xAxis, yAxis),
      // Add series here.
      series: series: [
        LineSeries(),
      ]
    );

    class CustomDoubleTapZoomPanBehavior extends ZoomPanBehavior {
      CustomDoubleTapZoomPanBehavior(this.xAxis, this.yAxis);

      CategoryAxis xAxis;
      NumericAxis yAxis;

      @override
      bool get enableDoubleTapZooming => true;

      bool _isZoomIn = true;

      @override
      void handleDoubleTap(Offset position) {
        if (parentBox == null && !enableDoubleTapZooming) {
          return;
        }
        const double origin = 0.5;
        final double cumulativeZoomLevel = _isZoomIn ? 1.4 : 1.0;
        double zoomFactor = 1 / cumulativeZoomLevel;
        double zoomPosition = (1 - zoomFactor) * origin;

        _isZoomIn = !_isZoomIn;
        zoomToSingleAxis(xAxis, zoomPosition, zoomFactor);
        zoomToSingleAxis(yAxis, zoomPosition, zoomFactor);
      }
    }
onPaint in ZoomPanBehavior
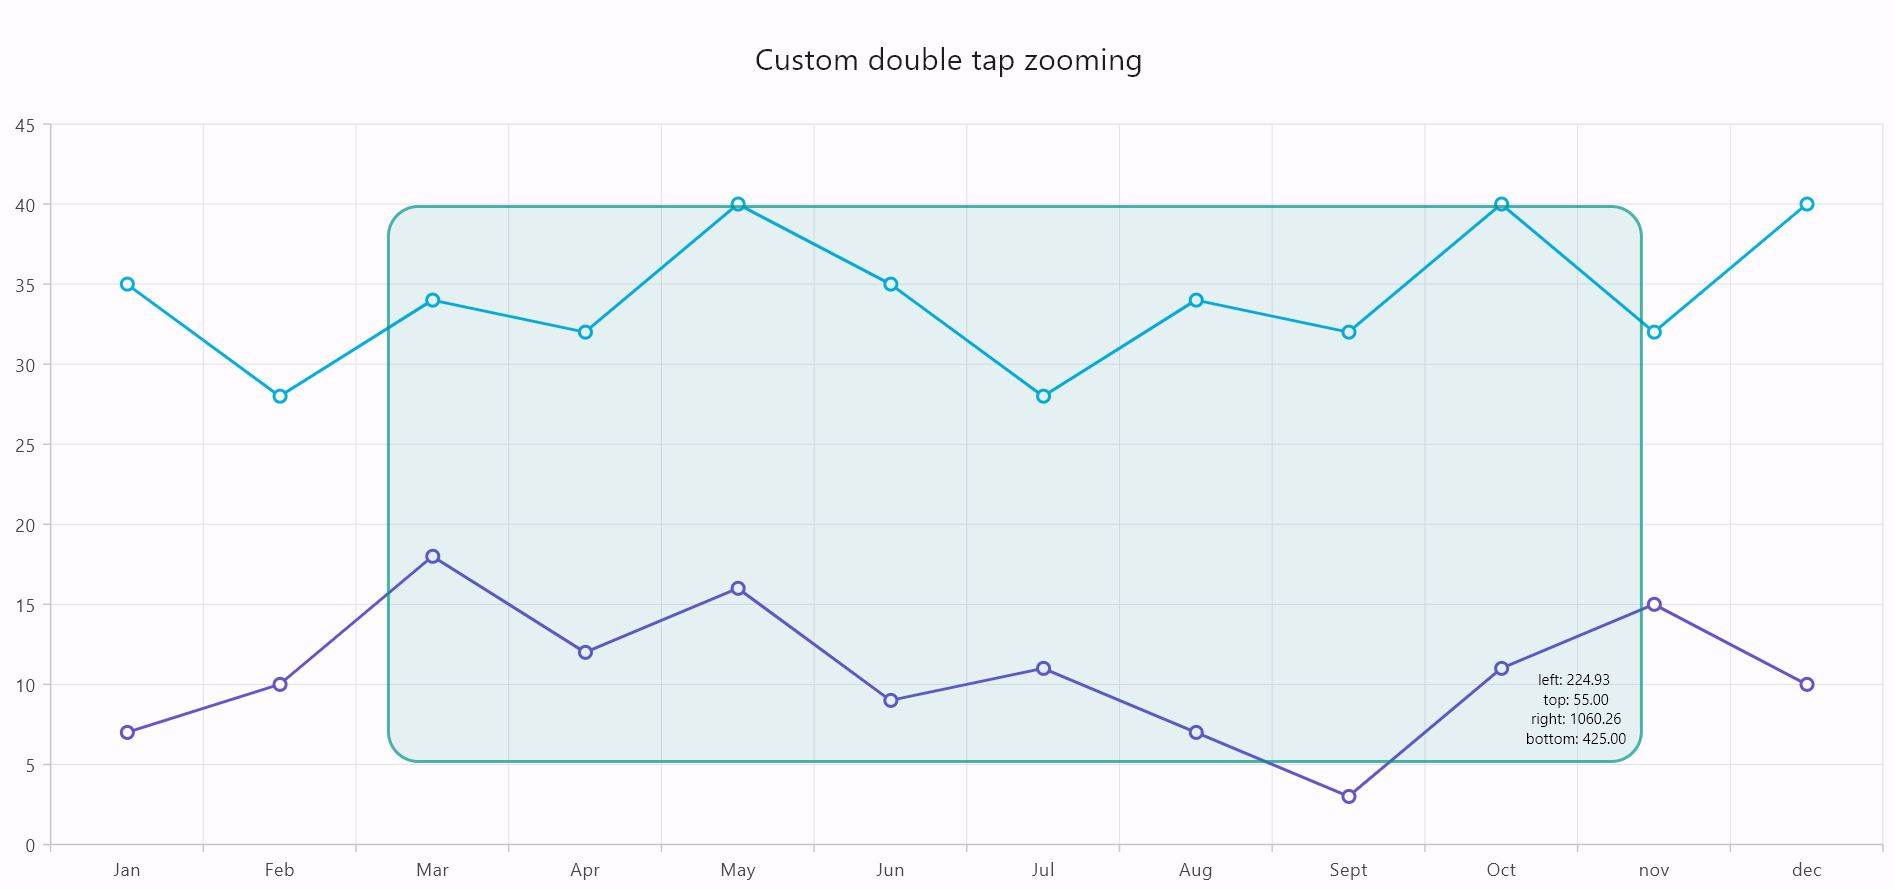
To customize the tooltip label, position, and selection rect of the zooming.
This following code sample defines how to perform selection zooming and customize the selection zooming rect in single tap using scale methods.
SfCartesianChart(
      zoomPanBehavior: CustomScaleZoomPanBehavior(),
      // Add series here.
      series: series: [
        LineSeries(),
      ]
    );

    class CustomScaleZoomPanBehavior extends ZoomPanBehavior {
      @override
      bool get enableSelectionZooming => true;

      RRect? _customRect;
      Rect? _zoomRect;
      Offset? _customRectStartPosition;
      Offset? _textPosition;

      @override
      void handleScaleStart(ScaleStartDetails details) {
        _customRectStartPosition = parentBox!.globalToLocal(details.focalPoint);
      }

      @override
      void handleScaleUpdate(ScaleUpdateDetails details) {
        if (details.pointerCount != 1 || !enableSelectionZooming) {
          return;
        }
        _calculateCustomRect(parentBox!.globalToLocal(details.focalPoint));
        parentBox!.markNeedsPaint();
      }

      @override
      void handleScaleEnd(ScaleEndDetails details) {
        _customRectStartPosition = null;
        _textPosition = null;
        zoomByRect(_zoomRect!);
        _customRect = RRect.zero;
        _zoomRect = Rect.zero;
        parentBox?.markNeedsPaint();
      }

      // Disable the long Press selection zooming behavior
      @override
      void handleLongPressStart(LongPressStartDetails details) {}

      // Disable the long Press selection zooming behavior
      @override
      void handleLongPressMoveUpdate(LongPressMoveUpdateDetails details) {}

      // Disable the long Press selection zooming behavior
      @override
      void handleLongPressEnd(LongPressEndDetails details) {}

      @override
      void onPaint(PaintingContext context, Offset offset,
          SfChartThemeData chartThemeData, ThemeData themeData) {
        if (_zoomRect == null || _textPosition == null) {
          return;
        }
        _drawCustomRect(context, chartThemeData, themeData);
        _drawText(context.canvas);
      }

      void _calculateCustomRect(Offset position) {
        if (parentBox == null) {
          return;
        }
        if (_customRectStartPosition != null) {
          final Rect clipRect = parentBox!.paintBounds;
          final Offset startPosition = Offset(
            max(_customRectStartPosition!.dx, clipRect.left),
            max(_customRectStartPosition!.dy, clipRect.top),
          );
          Offset currentPosition = position;
          final double currentX =
              _minMax(currentPosition.dx, clipRect.left, clipRect.right);
          final double currentY =
              _minMax(currentPosition.dy, clipRect.top, clipRect.bottom);
          currentPosition = Offset(currentX, currentY);
          double left = startPosition.dx > currentPosition.dx
              ? currentPosition.dx
              : startPosition.dx;
          double top = startPosition.dy > currentPosition.dy
              ? currentPosition.dy
              : startPosition.dy;
          double right = startPosition.dx < currentPosition.dx
              ? currentPosition.dx
              : startPosition.dx;
          double bottom = startPosition.dy < currentPosition.dy
              ? currentPosition.dy
              : startPosition.dy;
          _zoomRect = Rect.fromLTRB(left, top, right, bottom);
          _customRect = RRect.fromRectAndRadius(_zoomRect!, Radius.circular(20));
          _textPosition = currentPosition;
        }
      }

      void _drawCustomRect(PaintingContext context, SfChartThemeData chartThemeData,
          ThemeData themeData) {
        final Paint customRectPaint = Paint()..color = Colors.teal.withOpacity(0.1);
        final Paint customStrokeRectPaint = Paint()
          ..color = Colors.teal.withOpacity(0.7)
          ..style = PaintingStyle.stroke
          ..strokeWidth = 2;
        context.canvas.drawRRect(_customRect!, customRectPaint);
        context.canvas.drawRRect(_customRect!, customStrokeRectPaint);
      }

      double _minMax(double value, double min, double max) {
        return value > max ? max : (value < min ? min : value);
      }

      void _drawText(Canvas canvas) {
        String left = _zoomRect!.left.toStringAsFixed(2);
        String top = _zoomRect!.top.toStringAsFixed(2);
        String right = _zoomRect!.right.toStringAsFixed(2);
        String bottom = _zoomRect!.bottom.toStringAsFixed(2);
        String text =
            'left: $left \n top: $top \n right: $right \n bottom: $bottom';
        final TextSpan span = TextSpan(
            text: text, style: TextStyle(fontSize: 10, color: Colors.black));
        final TextPainter textPainter = TextPainter(
          text: span,
          textAlign: TextAlign.center,
          textDirection: TextDirection.ltr,
        );
        textPainter.layout();
        if (_zoomRect!.width < textPainter.width ||
            _zoomRect!.height < textPainter.height) {
          return;
        }
        double leftX = 0;
        double topY = 0;
        if (_zoomRect!.left == _textPosition!.dx) {
          leftX = 80;
        } else {
          leftX = -10;
        }
        if (_zoomRect!.top == _textPosition!.dy) {
          topY = 60;
        } else {
          topY = -10;
        }
        canvas.save();
        canvas.translate(_textPosition!.dx, _textPosition!.dy);
        final Offset labelOffset =
            Offset(-textPainter.width + leftX, -textPainter.height + topY);
        textPainter.paint(canvas, labelOffset);
        canvas.restore();
      }
    }
UpdateDataSource
Used to process only the newly added, updated, and removed data points in a series, instead of processing all the data points.
To re-render the chart with modified data points, setState() will be called. This will render the chart from scratch and thus, the app’s performance will be degraded on continuous updates.
To overcome this problem, the updateDataSource method can be called by passing updated data points indexes. The chart widget will process only that point and skip various steps like bounds calculation,
old data points processing, etc. Thus, this will improve the app’s performance.
The following are the arguments of this method.
-
addedDataIndexes-List<int>type - Indexes of newly added data points in the existing series. -
removedDataIndexes-List<int>type - Indexes of removed data points in the existing series. -
updatedDataIndexes-List<int>type - Indexes of updated data points in the existing series. -
addedDataIndex-inttype - Index of newly added data point in the existing series. -
removedDataIndex-inttype - Index of removed data point in the existing series. -
updatedDataIndex-inttype - Index of updated data point in the existing series.
Widget build(BuildContext context) {

    //Initialize the series controller
    ChartSeriesController? _chartSeriesController;

    @override
    Widget build(BuildContext context) {
      return Column(
        children: <Widget>[
          Container(
          child: SfCartesianChart(
                series: <LineSeries<ChartData, num>>[
                    LineSeries<ChartData, num>(
                      dataSource: chartData,
                      //Initialize the onRendererCreated event and store the controller for the respective series
                      onRendererCreated: (ChartSeriesController controller) {
                          _chartSeriesController = controller;
                      },
                    ),
                  ],
            )
          ),
          Container(
            child: ElevatedButton(
              onPressed: () {
                //Removed a point from data source
                chartData.removeAt(0);
                //Added a point to the data source
                chartData.add(ChartData(3,23));
                //Passed the necessary arguments to the updateDataSource method. Here passed the added and removed data point indexes.
                _chartSeriesController?.updateDataSource(
                  addedDataIndexes: <int>[chartData.length - 1],
                  removedDataIndexes: <int>[0],
                );
              }, child: Text('Add a point'),
            )
          )
        ]
      );
    }
  }

     class ChartData {
        ChartData(this.x, this.y);
        final num x;
        final double? y;
      }
See Also
PixelToPoint
Converts logical pixel value to the data point value.
The pixelToPoint method takes logical pixel value as input and returns a chart data point.
Since this method is in the series controller, x and y-axis associated with this particular series will be considering for conversion value.
//Initialize the series controller
    ChartSeriesController? seriesController;

    @override
    Widget build(BuildContext context) {
      return Container(
            child: SfCartesianChart(
             series: <CartesianSeries<ChartSampleData, num>>[
               LineSeries<ChartSampleData, num>(
                 onRendererCreated: (ChartSeriesController controller) {
                   seriesController = controller;
                 },
               )
             ],
             onChartTouchInteractionUp: (ChartTouchInteractionArgs args) {
               final Offset value = Offset(args.position.dx, args.position.dy);
               CartesianChartPoint<dynamic> chartpoint =
                 seriesController!.pixelToPoint(value);
               print('X point: ${chartpoint.x}');
               print('Y point: ${chartpoint.y}');
           }
         )
       );
    }

     class ChartSampleData{
        ChartSampleData(this.x, this.y);
        final num x;
        final double? y;
      }
PointToPixel
Converts chart data point value to logical pixel value.
The pointToPixel method takes chart data point value as input and returns logical pixel value.
Since this method is in the series controller, x and y-axis associated with this particular series will be considering for conversion value.
Note: This method is only applicable for Cartesian chart, not for the circular, pyramid,
and funnel charts.
//Initialize the series controller
    ChartSeriesController? seriesController;

    @override
    Widget build(BuildContext context) {
      return Container(
          child: SfCartesianChart(
              series: <CartesianSeries<ChartSampleData, num>>[
                ColumnSeries<ChartSampleData, num>(
                  onRendererCreated: (ChartSeriesController controller) {
                    seriesController = controller;
                  },
                )
              ],
              onPointTapped: (PointTapArgs args) {
                  CartesianChartPoint<dynamic> chartPoint =
                      CartesianChartPoint<dynamic>(data[args.pointIndex].x,
                          data[args.pointIndex].y);
                  Offset pointLocation = seriesController!.pointToPixel(chartPoint);
                  print('X location: ${pointLocation.x}');
                  print('Y location: ${pointLocation.y}');
              },
            )
      );
    }

    class ChartSampleData{
        ChartSampleData(this.x, this.y);
        final num x;
        final double? y;
      }
See Also
- Show or hide tooltip dynamically in Cartesian chart.
- Show or hide trackball dynamically in Cartesian chart.
- Show or hide crosshair dynamically in Cartesian chart.
Note:
chartDatain the above code snippets is a class type list and holds the data for binding to the chart series. Refer Bind data source topic for more details.