Flutter Cartesian Charts Multiple Charts (SfCartesianChart)
16 Apr 202610 minutes to read
Multiple series
You can add multiple series to the series property of the SfCartesianChart class. By default, all the series are rendered based on the PrimaryXAxis and PrimaryYAxis in SfCartesianChart. If you want to plot different unit or value that is specific to a particular series, specify separate axis for that series using the xAxisName and yAxisName properties of series.
@override
    Widget build(BuildContext context) {
        final List<ChartData> chartData = <ChartData>[
           ChartData('Germany', 128, 129, 101),
           ChartData('Russia', 123, 92, 93),
           ChartData('Norway', 107, 106, 90),
           ChartData('USA', 87, 95, 71),
        ];
        return Scaffold(
            body: Center(
                child: Container(
                    child: SfCartesianChart(
                        primaryXAxis: CategoryAxis(),
                        series: <CartesianSeries>[
                            ColumnSeries<ChartData, String>(
                                dataSource: chartData,
                                xValueMapper: (ChartData data, _) => data.x,
                                yValueMapper: (ChartData data, _) => data.y
                            ),
                            ColumnSeries<ChartData, String>(
                                dataSource: chartData,
                                xValueMapper: (ChartData data, _) => data.x,
                                yValueMapper: (ChartData data, _) => data.y1
                            ),
                            ColumnSeries<ChartData, String>(
                                dataSource: chartData,
                                xValueMapper: (ChartData data, _) => data.x,
                                yValueMapper: (ChartData data, _) => data.y2
                            )
                        ]
                    )
                )
            )
        );
    }

     class ChartData {
        ChartData(this.x, this.y, this.y1, this.y2);
        final String x;
        final double? y;
        final double? y1;
        final double? y2;
      }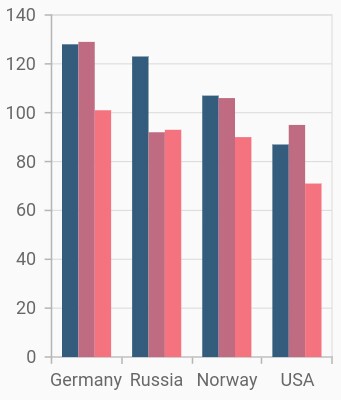
Also refer multiple axes for customizing the axis further.
Combination series
SfCartesianChart allows you to render a combination of different types of series. The column and line type series have been combined in the following code snippet.
@override
    Widget build(BuildContext context) {
        final List<ChartData> chartData = <ChartData>[
            ChartData('Germany', 129),
            ChartData('Russia', 90),
            ChartData('USA', 107),
            ChartData('Norway', 68),
        ];
        return Scaffold(
            body: Center(
                child: Container(
                    child: SfCartesianChart(
                        primaryXAxis: CategoryAxis(),
                        series: <CartesianSeries>[
                            // Render column series
                            ColumnSeries<ChartData, String>(
                                dataSource: chartData,
                                xValueMapper: (ChartData data, _) => data.x,
                                yValueMapper: (ChartData data, _) => data.y
                            ),
                            // Render line series
                            LineSeries<ChartData, String>(
                                dataSource: chartData,
                                xValueMapper: (ChartData data, _) => data.x,
                                yValueMapper: (ChartData data, _) => data.y
                            )
                        ]
                    )
                )
            )
        );
    }

    class ChartData {
        ChartData(this.x, this.y);
        final String x;
        final double? y;
      }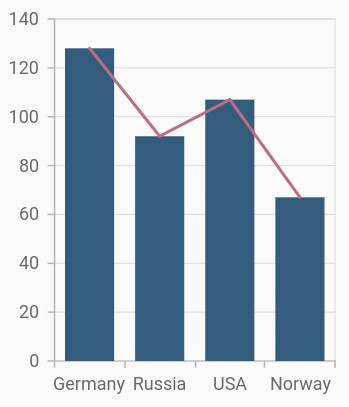
Limitation of combination chart
- Cartesian type series cannot be combined with circular series (pie, doughnut, and radial bar).
Note:
chartDatain the above code snippets is a class type list and holds the data for binding to the chart series. Refer Bind data source topic for more details.- You can refer to our Flutter Combination Chart feature tour page for its groundbreaking feature representations.