Range area Chart in Flutter Cartesian Charts (SfCartesianChart)
17 Mar 20267 minutes to read
To create a Flutter range area chart quickly, you can check this video.
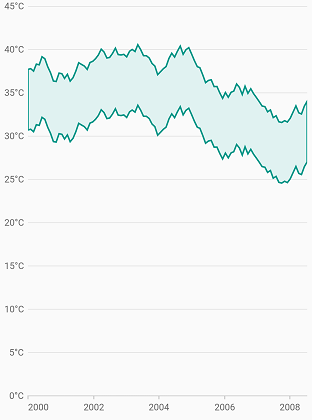
To render a range area chart, create an instance of RangeAreaSeries and add to the series collection property of SfCartesianChart.
Since the RangeAreaSeries requires two Y values for a point, your data should contain high and low values. High and low value specifies the maximum and minimum range of the point.
-
highValueMapper- field in the data source, which is considered as high value for the data points. -
lowValueMapper- field in the data source, which is considered as low value for the data points.
@override
    Widget build(BuildContext context) {
         return Scaffold(
            body: Center(
                child: Container(
                    child: SfCartesianChart(
                        primaryXAxis: DateTimeAxis(),
                        series: <CartesianSeries>[
                            RangeAreaSeries<ChartData, DateTime>(
                                dataSource: chartData,
                                xValueMapper: (ChartData data, _) => data.x,
                                lowValueMapper: (ChartData data, _) => data.low,
                                highValueMapper: (ChartData data, _) => data.high,
                            )
                        ]
                    )
                )
            )
        );
    }

    class ChartData {
        ChartData(this.x, this.high, this.low);
            final DateTime x;
            final double high;
            final double low;
    }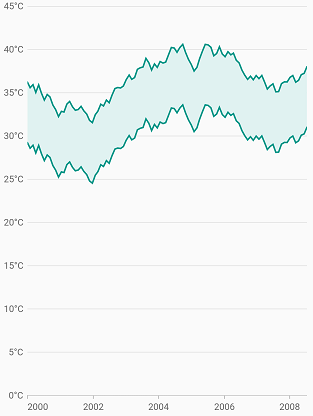
Border customization
The borders of the range area chart can be customized using the borderDrawMode property. The default value of the RangeAreaBorderMode property is all and the other value is excludeSides.
@override
    Widget build(BuildContext context) {
        return Scaffold(
            body: Center(
                child: Container(
                    child: SfCartesianChart(
                        primaryXAxis: DateTimeAxis(),
                        series: <CartesianSeries>[
                            RangeAreaSeries<ChartData, DateTime>(
                                dataSource: chartData,
                                color: Color.fromARGB(224, 242, 241,1),
                                borderDrawMode: RangeAreaBorderMode.excludeSides,
                                borderColor: Colors.green,
                                borderWidth: 2,
                                xValueMapper: (ChartData data, _) => data.x,
                                lowValueMapper: (ChartData data, _) => data.low,
                                highValueMapper: (ChartData data, _) => data.high,
                            )
                        ]
                    )
                )
            )
        );
    }