Flutter Cartesian Charts Spline Chart (SfCartesianChart)
16 Apr 202615 minutes to read
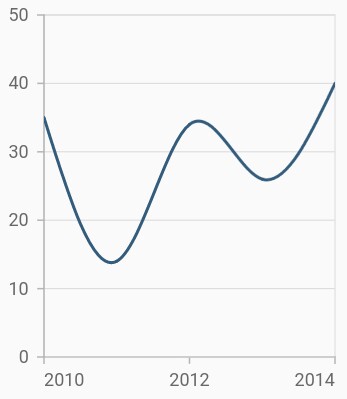
To render a spline chart, create an instance of SplineSeries, and add it to the series collection property of SfCartesianChart. The following properties can be used to customize the appearance of the spline segment:
-
color- changes the color of the series. -
opacity- controls the transparency of the chart series. -
width- changes the stroke width of the series.
@override
    Widget build(BuildContext context) {
        final List<ChartData> chartData = [
            ChartData(2010, 35),
            ChartData(2011, 13),
            ChartData(2012, 34),
            ChartData(2013, 27),
            ChartData(2014, 40)
        ];
        return Scaffold(
            body: Center(
                child: Container(
                    child: SfCartesianChart(
                        series: <CartesianSeries>[
                            // Renders spline chart
                            SplineSeries<ChartData, int>(
                                dataSource: chartData,
                                xValueMapper: (ChartData data, _) => data.x,
                                yValueMapper: (ChartData data, _) => data.y
                                )
                            ]
                        )
                    )
                )
            );
        }

    class ChartData {
        ChartData(this.x, this.y);
        final int x;
        final double? y;
    }
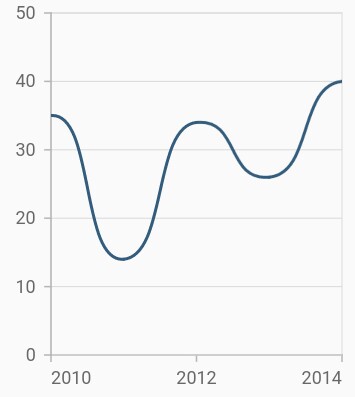
Spline rendering types
The splineType allows you to change the spline curve in series. The following types can be used in SplineSeries:
- natural
- monotonic
- cardinal
- clamped
By default, the value of splineType is SplineType.natural.
The following code sample demonstrates how to set the splineType value to SplineType.cardinal. When you set the cardinal type, you can specify the desired line tension of the cardinal spline using the cardinalSplineTension property. The value of this property ranges from 0 to 1.
@override
    Widget build(BuildContext context) {
        final List<ChartData> chartData = [
            ChartData(2010, 35),
            ChartData(2011, 13),
            ChartData(2012, 34),
            ChartData(2013, 27),
            ChartData(2014, 40)
        ];
        return Scaffold(
            body: Center(
                child: Container(
                    child: SfCartesianChart(
                        series: <CartesianSeries>[
                            SplineSeries<ChartData, int>(
                                dataSource: chartData,
                                // Type of spline
                                splineType: SplineType.cardinal,
                                cardinalSplineTension: 0.9,
                                xValueMapper: (ChartData data, _) => data.x,
                                yValueMapper: (ChartData data, _) => data.y
                                )
                            ]
                        )
                    )
                )
            );
        }
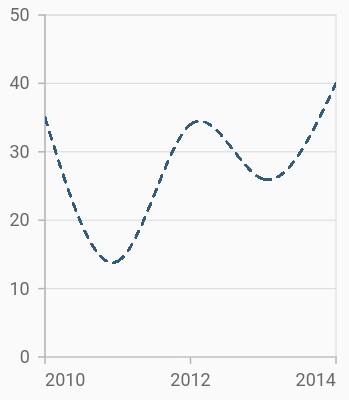
Dashed spline
The dashArray property of the SplineSeries is used to render spline series with dashes. The odd value is considered as the rendering size and the even value is considered as gap.
@override
    Widget build(BuildContext context) {
        final List<ChartData> chartData = [
            ChartData(2010, 35),
            ChartData(2011, 13),
            ChartData(2012, 34),
            ChartData(2013, 27),
            ChartData(2014, 40)
        ];
        return Scaffold(
            body: Center(
                child: Container(
                    child: SfCartesianChart(
                        series: <CartesianSeries>[
                            SplineSeries<ChartData, int>(
                                dataSource: chartData,
                                // Dash values for spline
                                dashArray: <double>[5, 5],
                                xValueMapper: (ChartData data, _) => data.x,
                                yValueMapper: (ChartData data, _) => data.y
                                )
                            ]
                        )
                    )
                )
            );
        }
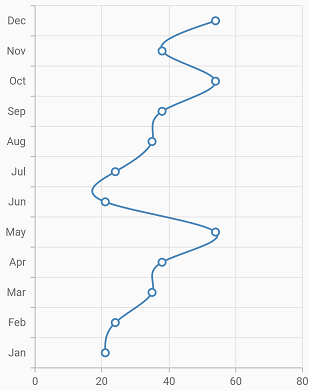
Vertical spline chart
The isTransposed property of CartesianSeries is used to transpose the horizontal and vertical axes, to view the data in a different perspective. Using this feature, you can render vertical Spline chart.
@override
    Widget build(BuildContext context) {
        final List<ChartData> chartData = <ChartData>[
                ChartData('Jan', 21),
                ChartData('Feb', 24),
                ChartData('Mar', 35),
                ChartData('Apr', 38),
                ChartData('May', 54),
                ChartData('Jun', 21),
                ChartData('Jul', 24),
                ChartData('Aug', 35),
                ChartData('Sep', 38),
                ChartData('Oct', 54),
                ChartData('Nov', 38),
                ChartData('Dec', 54)
             ];
        return Scaffold(
            body: Center(
                child: Container(
                    child: SfCartesianChart(
                        isTransposed: true,
                        primaryXAxis: CategoryAxis(),
                        series: <CartesianSeries>[
                            SplineSeries<ChartData, String>(
                                dataSource: chartData,
                                xValueMapper: (ChartData data, _) => data.x,
                                yValueMapper: (ChartData data, _) => data.y
                                )
                            ]
                        )
                    )
                )
            );
        }

    class ChartData {
        ChartData(this.x, this.y);
        final String x;
        final double? y;
    }