100% Stacked bar Chart in Flutter Cartesian Charts (SfCartesianChart)
23 Jul 202511 minutes to read
To create a Flutter 100% stacked bar chart quickly, you can check this video.
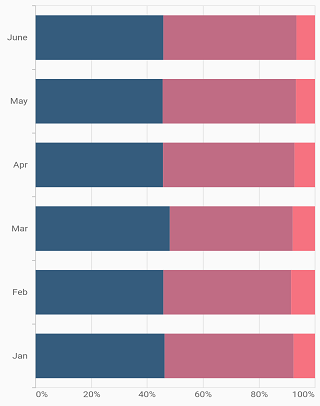
To render a 100% stacked bar chart, create an instance of StackedBar100Series, and add it to the series collection property of SfCartesianChart. The following properties can be used to customize the appearance:
-
color- changes the color of the series. -
opacity- controls the transparency of the chart series. -
borderWidth- changes the stroke width of the series. -
borderColor- changes the stroke color of the series. -
borderRadius- used to add the rounded corners to the rectangle.
List<ChartData> chartData = [
        ChartData('Jan', 45, 47, 40),
        ChartData('Feb', 45, 47, 41),
        ChartData('Mar', 50, 42, 42),
        ChartData('Apr', 44, 48, 40),
        ChartData('May', 43, 49, 43),
        ChartData('June', 44, 48, 42),
    ];
    @override
    Widget build(BuildContext context) {
        return Scaffold(
            body: Center(
                child: Container(
                    child: SfCartesianChart(
                        primaryXAxis: CategoryAxis(),
                        series: <CartesianSeries>[
                            StackedBar100Series<ChartData, String>(
                                dataSource: chartData,
                                xValueMapper: (ChartData data, _) => data.x,
                                yValueMapper: (ChartData data, _) => data.y
                            ),
                            StackedBar100Series<ChartData, String>(
                                dataSource: chartData,
                                xValueMapper: (ChartData data, _) => data.x,
                                yValueMapper: (ChartData data, _) => data.y2
                            ),
                            StackedBar100Series<ChartData, String>(
                                dataSource: chartData,
                                xValueMapper: (ChartData data, _) => data.x,
                                yValueMapper: (ChartData data, _) => data.y3
                            )
                        ]
                    )
                )
            )
        );
    }
    class ChartData {
        final String x;
        final num y;
        final num y2;
        final num y3;
        ChartData(this.x, this.y, this.y2, this.y3);
    }
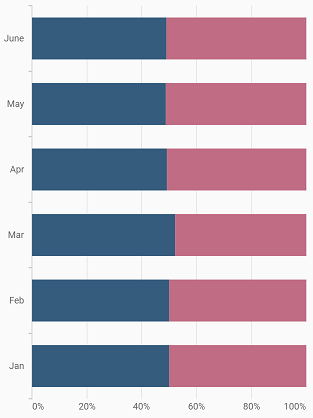
Bar width and spacing
The spacing property is used to change the spacing between two segments. The default value of spacing is 0, and the value ranges from 0 to 1. Here, 1 and 0 correspond to 100% and 0% of the available space, respectively.
The width property is used to change the width of the rectangle. The default value of the width is 0.7, and the value ranges from 0 to 1. Here, 1 and 0 correspond to 100% and 0% of the available width, respectively.
List<ChartData> chartData = [
        ChartData('Jan', 45, 47),
        ChartData('Feb', 45, 47),
        ChartData('Mar', 50, 42),
        ChartData('Apr', 44, 48),
        ChartData('May', 43, 49),
        ChartData('June', 44, 48),
    ];
    @override
    Widget build(BuildContext context) {
        return Scaffold(
            body: Center(
                child: Container(
                    child: SfCartesianChart(
                        primaryXAxis: CategoryAxis(),
                        series: <CartesianSeries>[
                            StackedBar100Series<ChartData, String>(
                                dataSource: chartData,
                                xValueMapper: (ChartData data, _) => data.x,
                                yValueMapper: (ChartData data, _) => data.y,
                                width: 0.8,
                                spacing: 0.2
                            ),
                            StackedBar100Series<ChartData, String>(
                                dataSource: chartData,
                                xValueMapper: (ChartData data, _) => data.x,
                                yValueMapper: (ChartData data, _) => data.y2,
                                width: 0.8,
                                spacing: 0.2
                            )
                        ]
                    )
                )
            )
        );
    }
    class ChartData {
        final String x;
        final num y;
        final num y2;
        ChartData(this.x, this.y, this.y2);
    }