Error bar chart in Flutter Cartesian Charts (SfCartesianChart)
23 Jul 202516 minutes to read
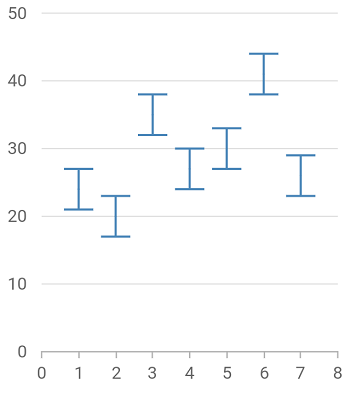
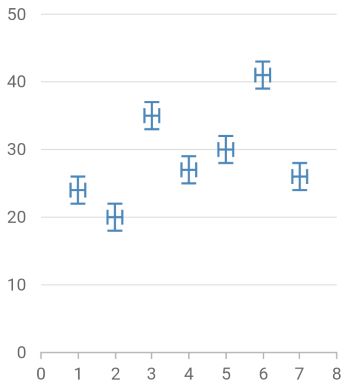
Error bars are graphical representations of the variability of data and used on graphs to indicate the error or uncertainty in a reported measurement.
To render an error bar chart, create an instance of ErrorBarSeries, and add it to the series collection property of SfCartesianChart. The following properties can be used to customize the appearance:
-
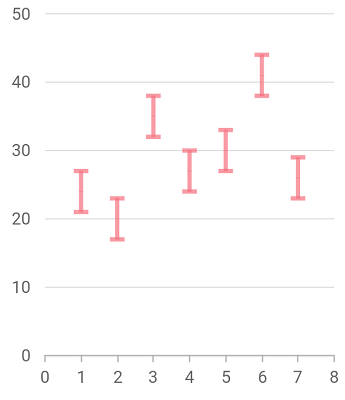
color- changes the stroke width of the line. -
opacity- controls the transparency of the chart series. -
width- changes the stroke width of the line. -
dashArray- renders error bar with dashes. -
pointColorMapper- maps the individual colors to the data point.
Marker, data label, trendline, Technical indicators, and other user interaction features are not applicable for error bar series. And events like onPointTap, onPointDoubleTap and onPointLongPress are not applicable for this series.
@override
    Widget build(BuildContext context) {
      final dynamic chartData = [
        ChartData(1, 24),
        ChartData(2, 20),
        ChartData(3, 35),
        ChartData(4, 27),
        ChartData(5, 30),
        ChartData(6, 41),
        ChartData(7, 26)
      ];

      return Scaffold(
        body: SfCartesianChart(
              series: <CartesianSeries<ChartData, int>>[
                ErrorBarSeries<ChartData, int>(
                  width: 3.0,
                  opacity: 0.7,
                  color: Color.fromRGBO(246, 114, 128, 1),
                  dataSource: chartData,
                  xValueMapper: (ChartData data, _) => data.x,
                  yValueMapper: (ChartData data, _) => data.y
               )
             ]
           )
        );
      }

    class ChartData {
      ChartData(this.x, this.y);
      final int x;
      final int y;
    }
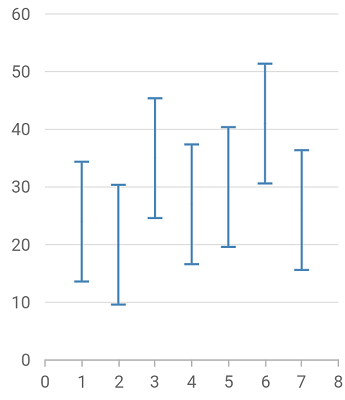
Type
The type property is used to define the error bar type value. The default value of this property is ErrorBarType.fixed, and other values are ErrorBarType.custom, ErrorBarType.percentage, ErrorBarType.standardDeviation and ErrorBarType.standardError.
You can customize the error bar depending on the error value by setting the values for horizontalErrorValue and verticalErrorValue for all types except ErrorBarType.custom.
-
horizontalErrorValue- This property horizontally depicts the error value in positive and negative directions. The default value is1. -
verticalErrorValue- This property vertically depicts the error value in positive and negative directions. The default value is3.
@override
    Widget build(BuildContext context) {
      final dynamic chartData = [
        ChartData(1, 24),
        ChartData(2, 20),
        ChartData(3, 35),
        ChartData(4, 27),
        ChartData(5, 30),
        ChartData(6, 41),
        ChartData(7, 26)
      ];

      return Scaffold(
        body: SfCartesianChart(
            series: <CartesianSeries<ChartData, int>>[
              ErrorBarSeries<ChartData, int>(
                dataSource: chartData,
                xValueMapper: (ChartData data, _) => data.x,
                yValueMapper: (ChartData data, _) => data.y,
                width: 1.5,
                type: ErrorBarType.standardError
                )
              ],
            )
         );
      }
Custom type
For ErrorBarType.custom type, you can customize the error bar depending on the error value by setting the values for horizontalPositiveErrorValue, horizontalNegativeErrorValue, verticalPositiveErrorValue and verticalNegativeErrorValue.
-
horizontalPositiveErrorValue- This property horizontally depicts the error value in positive direction. The default value is1. -
horizontalNegativeErrorValue- This property horizontally depicts the error value in negative direction. The default value is1. -
verticalPositiveErrorValue- This property vertically depicts the error value in positive direction. The default value is3. -
verticalNegativeErrorValue- This property vertically depicts the error value in negative direction. The default value is3.
@override
    Widget build(BuildContext context) {
      final dynamic chartData = [
        ChartData(1, 24),
        ChartData(2, 20),
        ChartData(3, 35),
        ChartData(4, 27),
        ChartData(5, 30),
        ChartData(6, 41),
        ChartData(7, 26)
      ];

      return Scaffold(
        body: SfCartesianChart(
            series: <CartesianSeries<ChartData, int>>[
              ErrorBarSeries<ChartData, int>(
                dataSource: chartData,
                xValueMapper: (ChartData data, _) => data.x,
                yValueMapper: (ChartData data, _) => data.y,
                width: 1.5,
                type: ErrorBarType.custom,
                mode: RenderingMode.both,
                verticalPositiveErrorValue: 5,
                verticalNegativeErrorValue: 2,
                horizontalPositiveErrorValue: 0.2,
                horizontalNegativeErrorValue: 0.5)
            ],
          )
        );
    }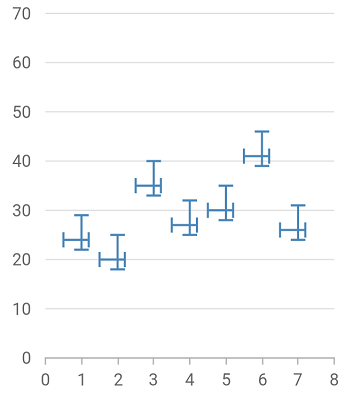
Mode
The error bar mode specifies whether the error bar should be drawn RenderingMode.horizontal, RenderingMode.vertical, or RenderingMode.both, ways. Use the mode option to switch the error bar mode.
The default value is RenderingMode.vertical. You can use the following properties to customize the mode.
-
RenderingMode.vertical- This property displays vertical error value only. -
RenderingMode.horizontal- This property displays horizontal error value only. -
RenderingMode.both- This property displays both vertical and horizontal error values.
@override
    Widget build(BuildContext context) {
      final dynamic chartData = [
        ChartData(1, 24),
        ChartData(2, 20),
        ChartData(3, 35),
        ChartData(4, 27),
        ChartData(5, 30),
        ChartData(6, 41),
        ChartData(7, 26)
      ];

      return Scaffold(
        body: SfCartesianChart(
            series: <CartesianSeries<ChartData, int>>[
              ErrorBarSeries<ChartData, int>(
                dataSource: chartData,
                xValueMapper: (ChartData data, _) => data.x,
                yValueMapper: (ChartData data, _) => data.y,
                width: 1.5,
                mode:RenderingMode.both,
                verticalErrorValue:2,
                horizontalErrorValue:0.2
              )
          ],
        )
      );
    }
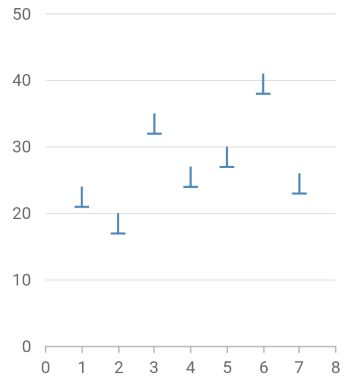
Direction
Using the direction option, you can alter the error bar direction to Direction.plus, Direction.minus, or Direction.both sides.
The default value is Direction.both. You can use the following properties to customize the direction.
-
Direction.both- Used to set error value in positive and negative directions. -
Direction.minus- Used to set error value in a negative direction. -
Direction.plus- Used to set error value in a positive direction.
@override
    Widget build(BuildContext context) {
      final dynamic chartData = [
        ChartData(1, 24),
        ChartData(2, 20),
        ChartData(3, 35),
        ChartData(4, 27),
        ChartData(5, 30),
        ChartData(6, 41),
        ChartData(7, 26)
      ];

      return Scaffold(
        body: SfCartesianChart(
            series: <CartesianSeries<ChartData, int>>[
              ErrorBarSeries<ChartData, int>(
                dataSource: chartData,
                xValueMapper: (ChartData data, _) => data.x,
                yValueMapper: (ChartData data, _) => data.y,
                width: 1.5,
                direction: Direction.minus
              )
           ],
         )
      );
    }
Cap length
The capLength property is used to customize the length of the error bar’s cap. The default value is 10.
@override
    Widget build(BuildContext context) {
      final dynamic chartData = [
        ChartData(1, 24),
        ChartData(2, 20),
        ChartData(3, 35),
        ChartData(4, 27),
        ChartData(5, 30),
        ChartData(6, 41),
        ChartData(7, 26)
      ];

      return Scaffold(
        body: SfCartesianChart(
            series: <CartesianSeries<ChartData, int>>[
              ErrorBarSeries<ChartData, int>(
                dataSource: chartData,
                xValueMapper: (ChartData data, _) => data.x,
                yValueMapper: (ChartData data, _) => data.y,
                width: 1.5,
                capLength: 20.0
              )
           ],
         )
      );
    }