Area Chart in Flutter Cartesian Charts (SfCartesianChart)
23 Jul 202520 minutes to read
To create a Flutter area chart quickly, you can check this video.
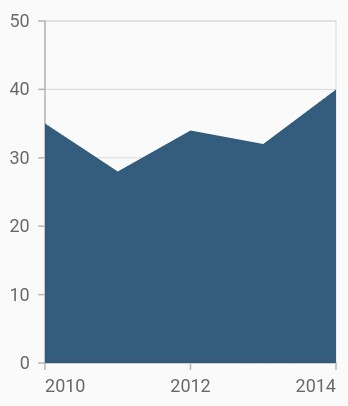
To render an area chart, create an instance of AreaSeries, and add it to the series collection property of SfCartesianChart. The area chart shows the filled area to represent the data, but when there are more than one series, this may hide the other series. To get rid of this, increase or decrease the transparency of the series.
The following properties can be used to customize the appearance:
-
color- changes the color of the series. -
opacity- controls the transparency of the chart series. -
borderWidth- changes the stroke width of the series. -
borderColor- changes the stroke color of the series.
@override
    Widget build(BuildContext context) {
        final List<ChartData> chartData = [
            ChartData(2010, 35),
            ChartData(2011, 28),
            ChartData(2012, 34),
            ChartData(2013, 32),
            ChartData(2014, 40)
        ];
        return Scaffold(
            body: Center(
                child: Container(
                    child: SfCartesianChart(
                        series: <CartesianSeries>[
                            // Renders area chart
                            AreaSeries<ChartData, int>(
                                dataSource: chartData,
                                xValueMapper: (ChartData data, _) => data.x,
                                yValueMapper: (ChartData data, _) => data.y
                            )
                        ]
                    )
                )
            )
        );
    }
    class ChartData {
        ChartData(this.x, this.y);
        final int x;
        final double y;
    }
Border customization
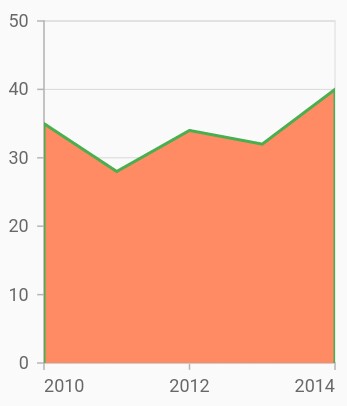
The borders of the area chart can be customized using the borderDrawMode property. The default value of the borderDrawMode property is BorderDrawMode.top. The other values are BorderDrawMode.all and BorderDrawMode.excludeBottom.
@override
    Widget build(BuildContext context) {
        return Scaffold(
            body: Center(
                child: Container(
                    child: SfCartesianChart(
                        primaryXAxis: DateTimeAxis(),
                        series: <CartesianSeries>[
                            AreaSeries<ChartData, DateTime>(
                                dataSource: chartData,
                                color: Colors.deepOrange[300],
                                borderDrawMode: BorderDrawMode.excludeBottom,
                                borderColor: Colors.green,
                                borderWidth: 2,
                                xValueMapper: (ChartData data, _) => data.x,
                                yValueMapper: (ChartData data, _) => data.y
                            )
                        ]
                    )
                )
            )
        );
    }
Area with gradients
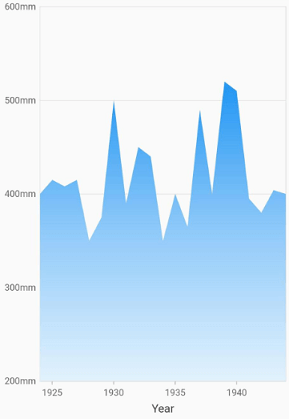
The gradient property is used to define the gradient colors. The colors from this property are used for the series.
@override
    Widget build(BuildContext context) {
        final List<ChartData> chartData = [
            ChartData(1924, 400),
            ChartData(1925, 410),
            ChartData(1926, 405),
            ChartData(1927, 410),
            ChartData(1928, 350),
            ChartData(1929, 370),
            ChartData(1930, 500),
            ChartData(1931, 390),
            ChartData(1932, 450),
            ChartData(1933, 440),
            ChartData(1934, 350),
            ChartData(1935, 370),
            ChartData(1936, 480),
            ChartData(1937, 410),
            ChartData(1938, 530),
            ChartData(1939, 520),
            ChartData(1940, 390),
            ChartData(1941, 360),
            ChartData(1942, 405),
            ChartData(1943, 400),
        ];
        final List<Color> color = <Color>[];
        color.add(Colors.blue[50]!);
        color.add(Colors.blue[200]!);
        color.add(Colors.blue);

        final List<double> stops = <double>[];
        stops.add(0.0);
        stops.add(0.5);
        stops.add(1.0);

        final LinearGradient gradientColors =
            LinearGradient(colors: color, stops: stops);

        return Scaffold(
            body: Center(
                child: Container(
                    child: SfCartesianChart(
                        primaryYAxis: NumericAxis(labelFormat: '{value}mm'),
                        series: <CartesianSeries>[
                            // Renders area chart
                            AreaSeries<ChartData, int>(
                                dataSource: chartData,
                                xValueMapper: (ChartData data, _) => data.x,
                                yValueMapper: (ChartData data, _) => data.y,
                                 gradient: gradientColors
                            )
                        ]
                    )
                )
            )
        );
    }
Area with empty points
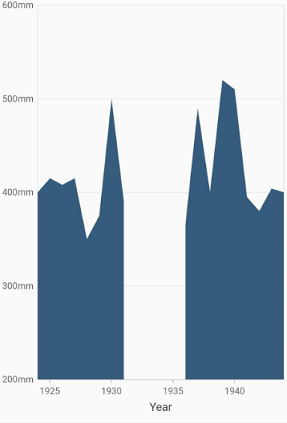
Data points with a null value are considered empty points. Empty data points are ignored and are not plotted in the chart. By using emptyPointSettings property in series, you can decide the action taken for empty points. Available modes are EmptyPointMode.gap, EmptyPointMode.zero, EmptyPointMode.drop and EmptyPointMode.average. Default mode of the empty point is EmptyPointMode.gap.
@override
    Widget build(BuildContext context) {
        final List<ChartData> chartData = [
            ChartData(DateTime(1924), 400),
            ChartData(DateTime(1925), 410),
            ChartData(DateTime(1926), 405),
            ChartData(DateTime(1927), 410),
            ChartData(DateTime(1928), 350),
            ChartData(DateTime(1929), 370),
            ChartData(DateTime(1930), 500),
            ChartData(DateTime(1931), 390),
            ChartData(DateTime(1932), null),
            ChartData(DateTime(1933), null),
            ChartData(DateTime(1934), null),
            ChartData(DateTime(1935), null),
            ChartData(DateTime(1936), null),
            ChartData(DateTime(1937), 410),
            ChartData(DateTime(1938), 530),
            ChartData(DateTime(1939), 520),
            ChartData(DateTime(1940), 390),
            ChartData(DateTime(1941), 360),
            ChartData(DateTime(1942), 405),
            ChartData(DateTime(1943), 400),
        ];
        return Scaffold(
            body: Center(
                child: Container(
                    child: SfCartesianChart(
                        primaryXAxis: DateTimeAxis(),
                        series: <CartesianSeries>[
                            AreaSeries<ChartData, DateTime>(
                                dataSource: chartData,
                                xValueMapper: (ChartData data, _) => data.x,
                                yValueMapper: (ChartData data, _) => data.y,
                                emptyPointSettings: EmptyPointSettings(mode: EmptyPointMode.zero)
                            )
                        ]
                    )
                )
            )
        );
    }
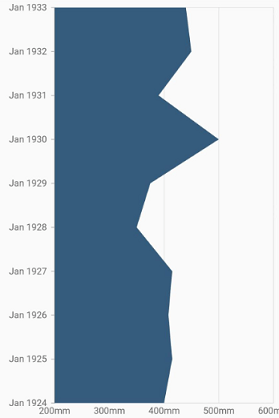
Vertical area chart
The isTransposed property of CartesianSeries is used to transpose the horizontal and vertical axes, to view the data in a different perspective. Using this feature, you can render vertical area chart.
@override
    Widget build(BuildContext context) {
        return Scaffold(
            body: Center(
                child: Container(
                    child: SfCartesianChart(
                        isTransposed: true,
                        primaryXAxis: DateTimeAxis(),
                        series: <CartesianSeries>[
                            AreaSeries<ChartData, DateTime>(
                                dataSource: chartData,
                                xValueMapper: (ChartData data, _) => data.x,
                                yValueMapper: (ChartData data, _) => data.y
                            )
                        ]
                    )
                )
            )
        );
    }
See Also
Note: You can refer to our Flutter Area Chart feature tour page for its groundbreaking feature representations. You can also explore our Flutter Area Chart example that shows how to easily configure with built-in support for creating stunning visual effects.