HiLo Chart in Flutter Cartesian Charts (SfCartesianChart)
23 Jul 20253 minutes to read
To create a Flutter hilo chart quickly, you can check this video.
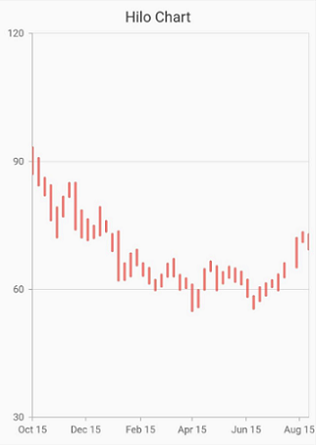
HiLo Series illustrates the price movements in stock using the high and low values.
To render a HiLo chart, create an instance of HiloSeries, and add it to the series collection property of SfCartesianChart. The following properties can be used to customize the appearance:
-
color- changes the color of the series. -
opacity- controls the transparency of the chart series. -
borderWidth- changes the stroke width of the series. -
borderColor- changes the stroke color of the series. -
lowValueMapper- used to get the low values from the series. -
highValueMapper- used to get the high values from the series.
@override
    Widget build(BuildContext context) {
        return Scaffold(
            body: Center(
                child: Container(
                    child: SfCartesianChart(
                        primaryXAxis: DateTimeAxis(),
                        series: <CartesianSeries>[
                            // Renders Hilo chart
                            HiloSeries<ChartData, DateTime>(
                                dataSource: financialData,
                                xValueMapper: (ChartData data, _) => data.x,
                                lowValueMapper: (ChartData data, _) => data.low,
                                highValueMapper: (ChartData data, _) => data.high
                            )
                        ]
                    )
                )
            )
        );
    }