Flutter Cartesian Charts Candle Chart (SfCartesianChart)
16 Apr 202622 minutes to read
To create a Flutter candle chart quickly, you can check this video.
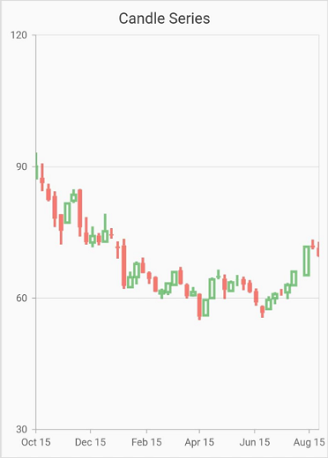
Flutter Candle series is similar to HiLo Open Close series, used to represent the low, high, open and closing price over time.
To render a Candle chart, create an instance of CandleSeries, and add it to the series collection property of SfCartesianChart. The following properties can be used to customize the appearance:
-
color- changes the color of the series. -
opacity- controls the transparency of the chart series. -
borderWidth- changes the stroke width of the series. -
showIndicationForSameValues- used to show indication of the data point with a thin line when its high and low values are same and also when all the values of high, low, open and close are same for the data point. By default is set to befalse. -
enableSolidCandles- used to enable/disable the solid candles. By default is set to befalse. The fill color of the candle will be defined by its opening and closing values. -
lowValueMapper- used to get the low values from the series. -
highValueMapper- used to get the high values from the series. -
openValueMapper- used to get the open values from the series. -
closeValueMapper- used to get the close values from the series. -
bearColor- bearFillColor will be applied when the opening value is less than the closing value. -
bullColor- bullFillColor will be applied when the opening value is greater than closing value.
@override
    Widget build(BuildContext context) {
        return Scaffold(
            body: Center(
                child: Container(
                    child: SfCartesianChart(
                        primaryXAxis: DateTimeAxis(),
                        series: <CartesianSeries>[
                            // Renders CandleSeries
                            CandleSeries<ChartData, DateTime>(
                                dataSource: financialData,
                                xValueMapper: (ChartData data, int index) => data.x,
                                lowValueMapper: (ChartData data, int index) => data.low,
                                highValueMapper: (ChartData data, int index) => data.high,
                                openValueMapper: (ChartData data, int index) => data.open,
                                closeValueMapper: (ChartData data, int index) => data.close,
                            )
                        ]
                    )
                )
            )
        );
    }
Candle width and spacing
The spacing property is used to change the spacing between two segments. The default value of spacing is 0, and the value ranges from 0 to 1. Here, 1 and 0 correspond to 100% and 0% of the available space, respectively.
The width property is used to change the width of the rectangle. The default value of the width is 0.7, and the value ranges from 0 to 1. Here, 1 and 0 correspond to 100% and 0% of the available width, respectively.
@override
    Widget build(BuildContext context) {
        final List<ChartData> chartData = [
            ChartData(
                x: 5,
                open: 86.3593,
                high: 88.1435,
                low: 84.3914,
                close: 86.3593),
            ChartData(
                x: 10,
                open: 85.4425,
                high: 86.4885,
                low: 86.4885,
                close: 87.001),
            ChartData(
                x: 15,
                open: 86.4885,
                high: 86.4885,
                low: 86.4885,
                close: 86.4885),
        ];
        return Scaffold(
            body: Center(
                child: SfCartesianChart(
                    series: <CartesianSeries<ChartData, int>>[
                        CandleSeries<ChartData, int>(
                            dataSource: chartData,
                            xValueMapper: (ChartData data, int index) => data.x,
                            highValueMapper: (ChartData data, int index) => data.high,
                            lowValueMapper: (ChartData data, int index) => data.low,
                            openValueMapper: (ChartData data, int index) => data.open,
                            closeValueMapper: (ChartData data, int index) => data.close,
                            // Width of the candle
                            width: 0.8,
                            // Spacing between the candles
                            spacing: 0.2
                        )
                    ]
                )
            )
        );
    }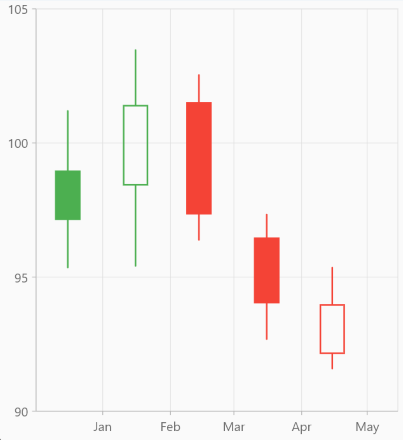
Rounded corners
The borderRadius property is used to add the rounded corners to the candle.
@override
    Widget build(BuildContext context) {
        final List<ChartData> chartData = [
            ChartData(
                x: 5,
                open: 86.3593,
                high: 88.1435,
                low: 84.3914,
                close: 86.3593),
            ChartData(
                x: 10,
                open: 85.4425,
                high: 86.4885,
                low: 86.4885,
                close: 87.001),
            ChartData(
                x: 15,
                open: 86.4885,
                high: 86.4885,
                low: 86.4885,
                close: 86.4885),
        ];
        return Scaffold(
            body: Center(
                child: SfCartesianChart(
                    series: <CartesianSeries<ChartData, int>>[
                        CandleSeries<ChartData, int>(
                            dataSource: chartData,
                            xValueMapper: (ChartData data, int index) => data.x,
                            highValueMapper: (ChartData data, int index) => data.high,
                            lowValueMapper: (ChartData data, int index) => data.low,
                            openValueMapper: (ChartData data, int index) => data.open,
                            closeValueMapper: (ChartData data, int index) => data.close,
                            // Sets the corner radius
                            borderRadius: BorderRadius.all(Radius.circular(15))
                        )
                    ]
                )
            )
        );
    }
See Also
Indication for same values
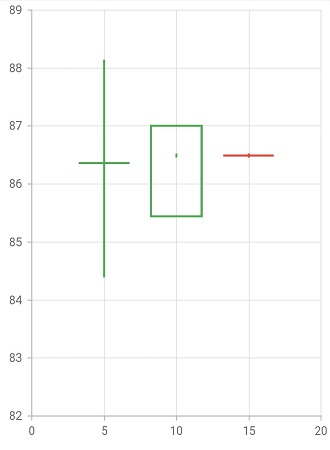
In the Candle series, there is a feature for the datapoints indication when their high and low values are same or open and close values or high, low, open and close values are same for a datapoint. For using this indication feature, showIndicationForSameValues property can be set to true.
The following are the types of indication when the combination of high, low, open and close values are same for a datapoint.
- In the Candle chart, if the open and close values are same then a horizontal line will be drawn at that value by default.
- If the high and low values are same and with
showIndicationForSameValuesproperty set to true then, a thin vertical line is drawn and if API is set to false, the line will not be drawn.
@override
    Widget build(BuildContext context) {
        return Scaffold(
            body: Center(
                child: SfCartesianChart(
                        series: <CartesianSeries>[
                          CandleSeries<ChartData, double>(
                            showIndicationForSameValues: true,
                            dataSource: <ChartData>[
                                ChartData( // Open and close values are same
                                    x: 5,
                                    open: 86.3593,
                                    high: 88.1435,
                                    low: 84.3914,
                                    close: 86.3593),
                                ChartData( // High and low values are same
                                    x: 10,
                                    open: 85.4425,
                                    high: 86.4885,
                                    low: 86.4885,
                                    close: 87.001),
                                ChartData( //High, low, open, and close values all are same
                                    x: 15,
                                    open: 86.4885,
                                    high: 86.4885,
                                    low: 86.4885,
                                    close: 86.4885),
                            ],
                            xValueMapper: (ChartData data, int index) => data.x,
                            highValueMapper: (ChartData data, int index) => data.high,
                            lowValueMapper: (ChartData data, int index) => data.low,
                            openValueMapper: (ChartData data, int index) => data.open,
                            closeValueMapper: (ChartData data, int index) => data.close)
                        ]
                    ),
                )
            );
        }