Scatter Chart in .NET MAUI Cartesian Chart
10 Jul 20262 minutes to read
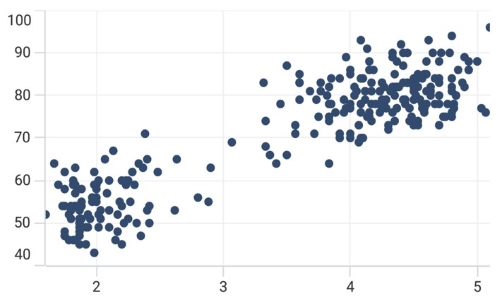
The scatter chart is used to represent each data point as a dot or circle of uniform size.
Scatter Chart
To render a scatter chart, create an instance of ScatterSeries and add it to the Series collection property of SfCartesianChart. The segment size can be defined using the PointHeight and PointWidth properties. Both properties are of type double, and the default value is 10. The Type property, of type ShapeType, allows you to change the rendering shape of the scatter segment. The default value is ShapeType.Circle.
NOTE
Prerequisite: Ensure that the required NuGet package is installed, the necessary namespaces are imported, and the SfCartesianChart control is properly configured in your application. For detailed setup and configuration instructions, refer to the Getting Started guide.
NOTE
The Cartesian chart has Series as its default content.
<chart:SfCartesianChart>
    <chart:SfCartesianChart.XAxes>
        <chart:NumericalAxis/>
    </chart:SfCartesianChart.XAxes>

    <chart:SfCartesianChart.YAxes>
        <chart:NumericalAxis/>
    </chart:SfCartesianChart.YAxes>

    <chart:ScatterSeries ItemsSource="{Binding Data}"
                         XBindingPath="XValue"
                         YBindingPath="YValue"
                         PointHeight="7"
                         PointWidth="7"/>
</chart:SfCartesianChart>
SfCartesianChart chart = new SfCartesianChart();
NumericalAxis primaryAxis = new NumericalAxis();
chart.XAxes.Add(primaryAxis);
NumericalAxis secondaryAxis = new NumericalAxis();
chart.YAxes.Add(secondaryAxis);
ScatterSeries series = new ScatterSeries()
{
ItemsSource = new ViewModel().Data,
XBindingPath = "XValue",
YBindingPath = "YValue",
PointHeight = 7,
PointWidth = 7,
};
chart.Series.Add(series);
this.Content = chart;