Box and Whisker Chart in .NET MAUI Cartesian Chart
10 Jul 202612 minutes to read
Box and Whisker Chart
A box plot chart is used to show the distribution of data within a population. To render a box plot chart, create an instance of BoxAndWhiskerSeries and add it to the Series collection property of SfCartesianChart.
NOTE
Prerequisite: Ensure that the required NuGet package is installed, the necessary namespaces are imported, and the SfCartesianChart control is properly configured in your application. For detailed setup and configuration instructions, refer to the Getting Started guide.
Box plots are great for comparing the distribution of multiple datasets side by side. By comparing the median, quartiles, and range of the boxes, you can quickly identify differences in the center, spread, and skewness of the distributions. The following code illustrates how to define the series in chart.
NOTE
The Cartesian chart has Series as its default content.
<chart:SfCartesianChart>

    <chart:SfCartesianChart.XAxes>
        <chart:CategoryAxis/>
    </chart:SfCartesianChart.XAxes>

    <chart:SfCartesianChart.YAxes>
        <chart:NumericalAxis/>
    </chart:SfCartesianChart.YAxes>

    <chart:BoxAndWhiskerSeries ItemsSource="{Binding BoxWhiskerData}"
                               XBindingPath="Department"
                               YBindingPath="Age"/>

</chart:SfCartesianChart>
SfCartesianChart chart = new SfCartesianChart();
CategoryAxis primaryAxis = new CategoryAxis();
chart.XAxes.Add(primaryAxis);
NumericalAxis secondaryAxis = new NumericalAxis();
chart.YAxes.Add(secondaryAxis);
BoxAndWhiskerSeries series = new BoxAndWhiskerSeries()
{
ItemsSource = new ViewModel().BoxWhiskerData,
XBindingPath = "Department",
YBindingPath = "Age",
};
chart.Series.Add(series);
this.Content = chart;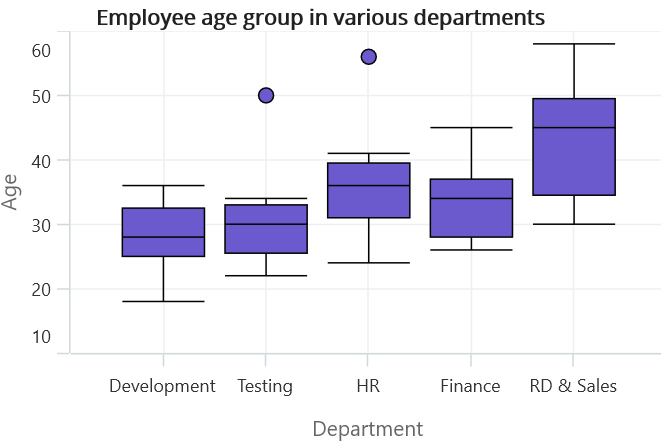
Customize the series Box mode
The series box plotting mode can be changed by using BoxPlotMode property of BoxAndWhiskerSeries. The plotting mode of series can be calculated as follows:
-
Exclusive- The quartile values are calculated by using the formula (N+1) * P (N count, P percentile) and its index value starts from 1 in the list. -
Inclusive- The quartile values are calculated by using the formula (N−1) * P (N count, P percentile) and its index value starts from 0 in the list. -
Normal- The quartile values are calculated by splitting the list and getting the median values.
By default, BoxPlotMode value is Exclusive.
Normal
In Normal mode, the whiskers extend to the minimum and maximum data points within two times the standard deviation of the data. This method assumes that the data is normally distributed. The following code illustrate how to define property BoxPlotMode value as Normal.
<chart:SfCartesianChart>

    <chart:SfCartesianChart.XAxes>
        <chart:CategoryAxis/>
    </chart:SfCartesianChart.XAxes>

    <chart:SfCartesianChart.YAxes>
        <chart:NumericalAxis/>
    </chart:SfCartesianChart.YAxes>

    <chart:BoxAndWhiskerSeries ItemsSource="{Binding BoxWhiskerData}"
                               XBindingPath="Department"
                               YBindingPath="Age"
                               BoxPlotMode="Normal"/>

</chart:SfCartesianChart>
SfCartesianChart chart = new SfCartesianChart();
CategoryAxis primaryAxis = new CategoryAxis();
chart.XAxes.Add(primaryAxis);
NumericalAxis secondaryAxis = new NumericalAxis();
chart.YAxes.Add(secondaryAxis);
BoxAndWhiskerSeries series = new BoxAndWhiskerSeries()
{
ItemsSource = new ViewModel().BoxWhiskerData,
XBindingPath = "Department",
YBindingPath = "Age",
BoxPlotMode = BoxPlotMode.Normal
};
chart.Series.Add(series);
this.Content = chart;
Inclusive
In Inclusive mode, the whiskers extend to the minimum and maximum data points within 1.5 times the IQR. Any points beyond this range are considered outliers. The following code illustrate how to define property BoxPlotMode value as Inclusive.
<chart:SfCartesianChart>

    <chart:SfCartesianChart.XAxes>
        <chart:CategoryAxis/>
    </chart:SfCartesianChart.XAxes>

    <chart:SfCartesianChart.YAxes>
        <chart:NumericalAxis/>
    </chart:SfCartesianChart.YAxes>

    <chart:BoxAndWhiskerSeries ItemsSource="{Binding BoxWhiskerData}"
                               XBindingPath="Department"
                               YBindingPath="Age"
                               BoxPlotMode="Inclusive"/>

</chart:SfCartesianChart>
SfCartesianChart chart = new SfCartesianChart();
CategoryAxis primaryAxis = new CategoryAxis();
chart.XAxes.Add(primaryAxis);
NumericalAxis secondaryAxis = new NumericalAxis();
chart.YAxes.Add(secondaryAxis);
BoxAndWhiskerSeries series = new BoxAndWhiskerSeries()
{
ItemsSource = new ViewModel().BoxWhiskerData,
XBindingPath = "Department",
YBindingPath = "Age",
BoxPlotMode = BoxPlotMode.Inclusive
};
chart.Series.Add(series);
this.Content = chart;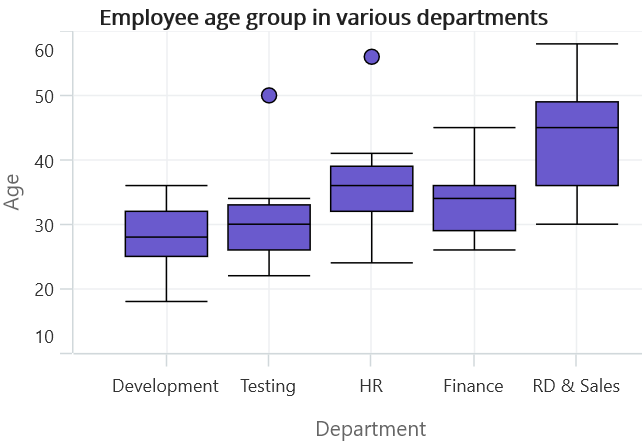
ShowMedian
The Median values of given dataset is viewed by enabling the ShowMedian property of BoxAndWhiskerSeries. By default, the ShowMedian property value is False. The following code illustrates how to enable the ShowMedian property.
<chart:SfCartesianChart>

    <chart:SfCartesianChart.XAxes>
        <chart:CategoryAxis/>
    </chart:SfCartesianChart.XAxes>

    <chart:SfCartesianChart.YAxes>
        <chart:NumericalAxis/>
    </chart:SfCartesianChart.YAxes>

    <chart:BoxAndWhiskerSeries ItemsSource="{Binding BoxWhiskerData}"
                               XBindingPath="Department"
                               YBindingPath="Age"
                               ShowMedian="True"/>

</chart:SfCartesianChart>
SfCartesianChart chart = new SfCartesianChart();
CategoryAxis primaryAxis = new CategoryAxis();
chart.XAxes.Add(primaryAxis);
NumericalAxis secondaryAxis = new NumericalAxis();
chart.YAxes.Add(secondaryAxis);
BoxAndWhiskerSeries series = new BoxAndWhiskerSeries()
{
ItemsSource = new ViewModel().BoxWhiskerData,
XBindingPath = "Department",
YBindingPath = "Age",
ShowMedian = true
};
chart.Series.Add(series);
this.Content = chart;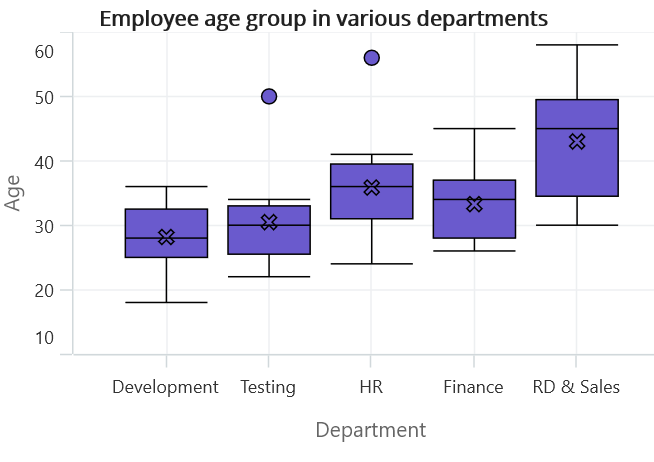
NOTE
- The middle number of data points is the median for the odd number of data points.
- The average of the middle two numbers is a median for the even number of data points.
Outlier
The outlier displays the outlier point that lies either under the lower whisker or above the upper whisker line. It is an observation numerically distant from the rest of the data.
ShowOutlier
The outlier value in the box plot can be viewed by enabling the ShowOutlier property of BoxAndWhiskerSeries.By default, ShowOutlier value is true. The following code demonstrates how to disable the ShowOutlier property.
<chart:SfCartesianChart>

    <chart:SfCartesianChart.XAxes>
        <chart:CategoryAxis/>
    </chart:SfCartesianChart.XAxes>

    <chart:SfCartesianChart.YAxes>
        <chart:NumericalAxis/>
    </chart:SfCartesianChart.YAxes>

    <chart:BoxAndWhiskerSeries ItemsSource="{Binding BoxWhiskerData}"
                               XBindingPath="Department"
                               YBindingPath="Age"
                               ShowOutlier="False"/>

</chart:SfCartesianChart>
SfCartesianChart chart = new SfCartesianChart();
CategoryAxis primaryAxis = new CategoryAxis();
chart.XAxes.Add(primaryAxis);
NumericalAxis secondaryAxis = new NumericalAxis();
chart.YAxes.Add(secondaryAxis);
BoxAndWhiskerSeries series = new BoxAndWhiskerSeries()
{
ItemsSource = new ViewModel().BoxWhiskerData,
XBindingPath = "Department",
YBindingPath = "Age",
ShowOutlier = false
};
chart.Series.Add(series);
this.Content = chart;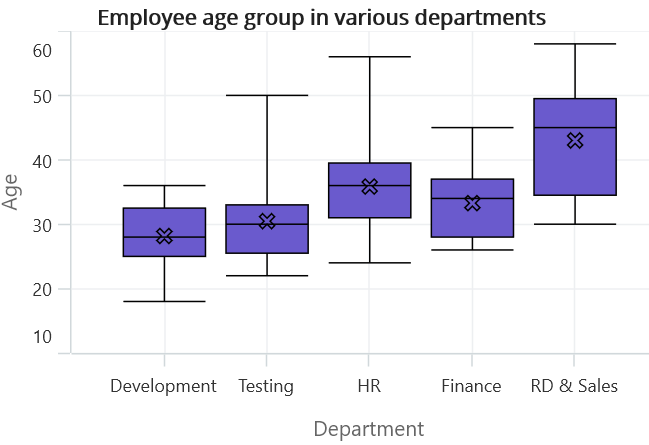
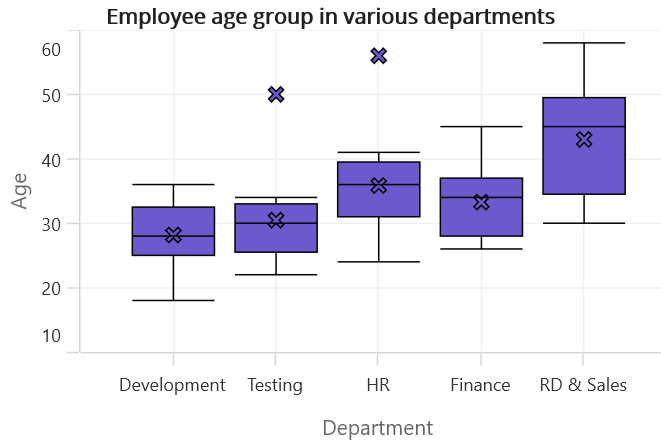
OutlierShapeType
The OutlierShapeType displays the outlier point with different symbols. The available symbols are Cross, Diamond, Circle, Hexagon, InvertedTriangle, Pentagon, Plus, Rectangle and Triangle. By default, OutlierShapeType value is Circle.
The following code shows how to set the OutlierShapeType value as Cross.
<chart:SfCartesianChart>

    <chart:SfCartesianChart.XAxes>
        <chart:CategoryAxis/>
    </chart:SfCartesianChart.XAxes>

    <chart:SfCartesianChart.YAxes>
        <chart:NumericalAxis/>
    </chart:SfCartesianChart.YAxes>

    <chart:BoxAndWhiskerSeries ItemsSource="{Binding BoxWhiskerData}"
                               XBindingPath="Department"
                               YBindingPath="Age"
                               OutlierShapeType="Cross"/>

</chart:SfCartesianChart>
SfCartesianChart chart = new SfCartesianChart();
CategoryAxis primaryAxis = new CategoryAxis();
chart.XAxes.Add(primaryAxis);
NumericalAxis secondaryAxis = new NumericalAxis();
chart.YAxes.Add(secondaryAxis);
BoxAndWhiskerSeries series = new BoxAndWhiskerSeries()
{
ItemsSource = new ViewModel().BoxWhiskerData,
XBindingPath = "Department",
YBindingPath = "Age",
OutlierShapeType = ShapeType.Cross
};
chart.Series.Add(series);
this.Content = chart;