Class SfCartesianChart
Renders different types of cartesian-type charts, each representing a unique style of representing data with a more user-friendly and greater UI visualization.
Implements
Inherited Members
Namespace: Syncfusion.Maui.Charts
Assembly: Syncfusion.Maui.Charts.dll
Syntax
public class SfCartesianChart : ChartBase, IContentView, IView, IElement, ITransform, IPadding, ICrossPlatformLayout, IChart, ITouchListener, IDoubleTapGestureListener, ITapGestureListener, IPanGestureListener, IPinchGestureListener, ILongPressGestureListener, IGestureListener, IParentThemeElement, IThemeElementRemarks
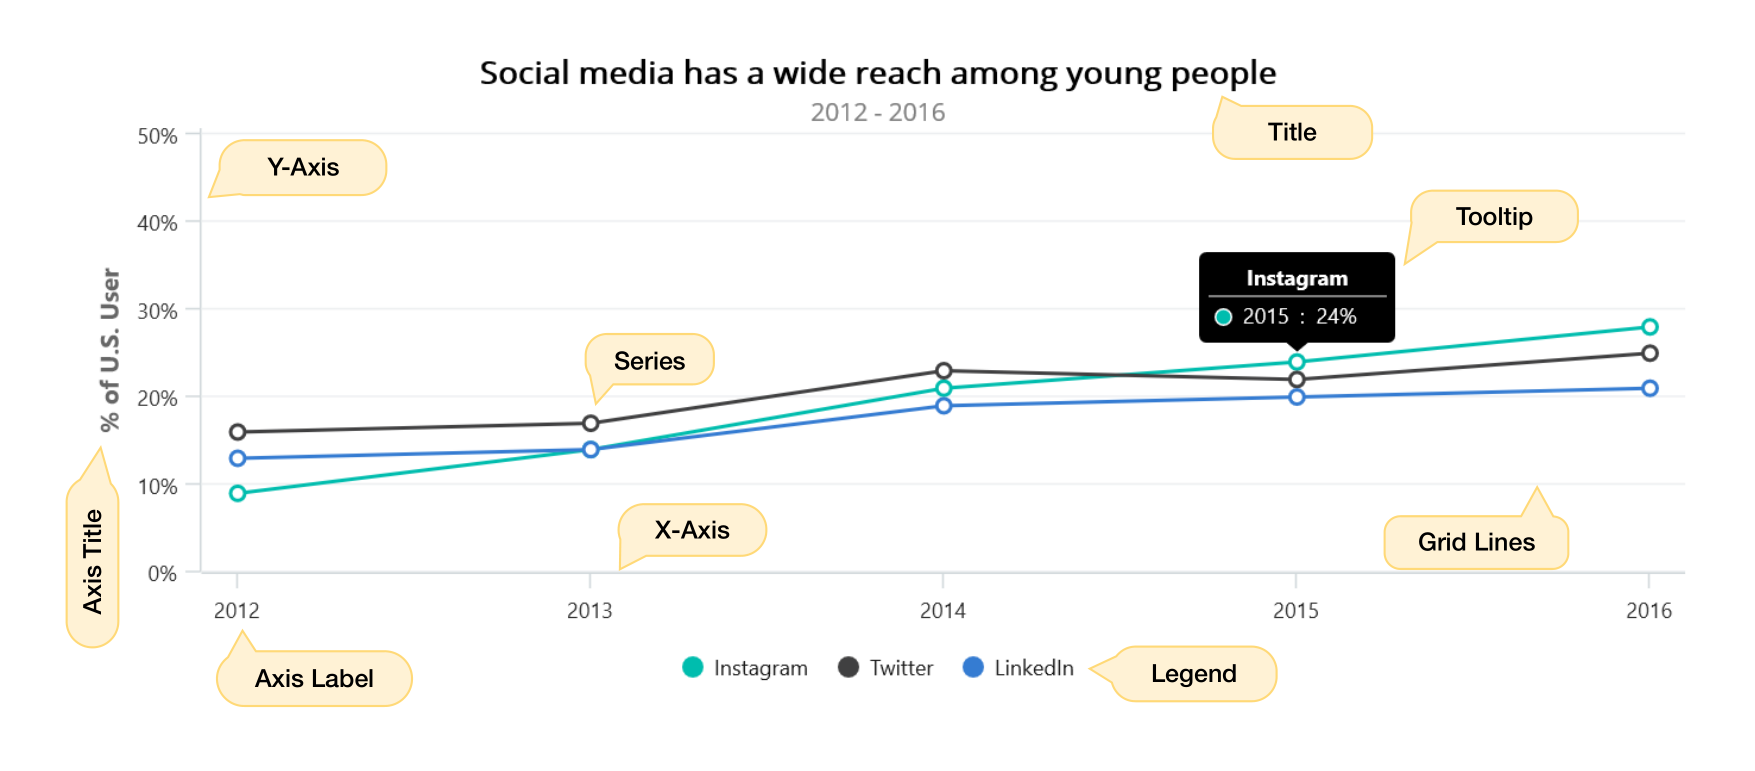
The Cartesian chart control is used to visualize the data graphically, it typically have horizontal and vertical axes.
SfCartesianChart class properties provides an option to add the series and axis collection, allows to customize the chart elements such as series, axis, legend, data label and tooltip features.
Axis
ChartAxis is used to locate a data point inside the chart area. Charts typically have two axes that are used to measure and categorize data. Vertical(Y) axis always uses numerical scale. Horizontal(X) axis supports the Category, Numeric and Date time.
To render an axis, the chart axis instance has to be added in chart’s XAxes and YAxes collection as per the following code snippet.
<chart:SfCartesianChart>

        <chart:SfCartesianChart.BindingContext>
            <local:ViewModel/>
        </chart:SfCartesianChart.BindingContext>

        <chart:SfCartesianChart.XAxes>
            <chart:NumericalAxis/>
        </chart:SfCartesianChart.XAxes>

        <chart:SfCartesianChart.YAxes>
            <chart:NumericalAxis/>
        </chart:SfCartesianChart.YAxes>

</chart:SfCartesianChart>Series
ChartSeries is the visual representation of data. SfCartesianChart offers many types such as Line, Fast line, Spline, Column, Scatter, Area and SplineArea series. Based on your requirements and specifications, any type of series can be added for data visualization.
To render a series, create an instance of required series class, and add it to the Series collection.
<chart:SfCartesianChart>

       <chart:SfCartesianChart.BindingContext>
           <local:ViewModel/>
       </chart:SfCartesianChart.BindingContext>

       <chart:SfCartesianChart.XAxes>
           <chart:NumericalAxis/>
       </chart:SfCartesianChart.XAxes>

       <chart:SfCartesianChart.YAxes>
           <chart:NumericalAxis/>
       </chart:SfCartesianChart.YAxes>

       <chart:SfCartesianChart.Series>
           <chart:LineSeries ItemsSource = "{Binding Data}" XBindingPath="XValue" YBindingPath="YValue1"/>
           <chart:LineSeries ItemsSource = "{Binding Data}" XBindingPath="XValue" YBindingPath="YValue2"/>
       </chart:SfCartesianChart.Series>
</chart:SfCartesianChart>Legend
The Legend contains list of chart series or data points in chart. The information provided in each legend item helps to identify the corresponding data series in chart. The Series Label property text will be displayed in the associated legend item.
To render a legend, create an instance of ChartLegend, and assign it to the Legend property.
<chart:SfCartesianChart>

       <chart:SfCartesianChart.BindingContext>
           <local:ViewModel/>
       </chart:SfCartesianChart.BindingContext>

       <chart:SfCartesianChart.Legend>
           <chart:ChartLegend/>
       </chart:SfCartesianChart.Legend>

       <chart:SfCartesianChart.XAxes>
           <chart:NumericalAxis/>
       </chart:SfCartesianChart.XAxes>

       <chart:SfCartesianChart.YAxes>
           <chart:NumericalAxis/>
       </chart:SfCartesianChart.YAxes>

       <chart:SfCartesianChart.Series>
           <chart:LineSeries Label="Singapore" ItemsSource = "{Binding Data}" XBindingPath="XValue" YBindingPath="YValue1"/>
           <chart:LineSeries Label="Spain" ItemsSource = "{Binding Data}" XBindingPath="XValue" YBindingPath="YValue2"/>
       </chart:SfCartesianChart.Series>
</chart:SfCartesianChart>Tooltip
Tooltip displays information while tapping or mouse hover on the segment. To display the tooltip on chart, you need to set the EnableTooltip property as true in ChartSeries.
To customize the appearance of the tooltip elements like Background, TextColor and Font, create an instance of ChartTooltipBehavior class, modify the values, and assign it to the chart’s TooltipBehavior property.
<chart:SfCartesianChart>

        <chart:SfCartesianChart.BindingContext>
            <local:ViewModel/>
        </chart:SfCartesianChart.BindingContext>

        <chart:SfCartesianChart.TooltipBehavior>
            <chart:ChartTooltipBehavior/>
        </chart:SfCartesianChart.TooltipBehavior>

        <chart:SfCartesianChart.XAxes>
            <chart:NumericalAxis/>
        </chart:SfCartesianChart.XAxes>

        <chart:SfCartesianChart.YAxes>
            <chart:NumericalAxis/>
        </chart:SfCartesianChart.YAxes>

        <chart:SfCartesianChart.Series>
            <chart:LineSeries EnableTooltip = "True" ItemsSource="{Binding Data}" XBindingPath="XValue" YBindingPath="YValue1"/>
            <chart:LineSeries EnableTooltip = "True" ItemsSource="{Binding Data}" XBindingPath="XValue" YBindingPath="YValue2"/>
        </chart:SfCartesianChart.Series>

</chart:SfCartesianChart>Data Label
Data labels are used to display values related to a chart segment. To render the data labels, you need to enable the ShowDataLabels property as true in ChartSeries class.
To customize the chart data labels alignment, placement and label styles, need to create an instance of CartesianDataLabelSettings and set to the DataLabelSettings property.
<chart:SfCartesianChart>

       <chart:SfCartesianChart.BindingContext>
           <local:ViewModel/>
       </chart:SfCartesianChart.BindingContext>

       <chart:SfCartesianChart.XAxes>
           <chart:NumericalAxis/>
       </chart:SfCartesianChart.XAxes>

       <chart:SfCartesianChart.YAxes>
           <chart:NumericalAxis/>
       </chart:SfCartesianChart.YAxes>

       <chart:SfCartesianChart.Series>
           <chart:ColumnSeries ShowDataLabels = "True" ItemsSource="{Binding Data}" XBindingPath="XValue" YBindingPath="YValue1"/>
       </chart:SfCartesianChart.Series>
</chart:SfCartesianChart>Zooming and Panning
SfCartesianChart allows you to zoom the chart area with the help of the zoom feature. This behavior is mostly used to view the data point in the specific area, when there are large number of data points inside the chart.
Zooming and panning provides you to take a close-up look of the data point plotted in the series. To enable the zooming and panning in the chart, create an instance of ChartZoomPanBehavior and set it to the ZoomPanBehavior property of SfCartesianChart.
<chart:SfCartesianChart>

       <chart:SfCartesianChart.BindingContext>
           <local:ViewModel/>
       </chart:SfCartesianChart.BindingContext>

       <chart:SfCartesianChart.ZoomPanBehavior>
           <chart:ChartZoomPanBehavior EnablePanning = "True" EnableDoubleTap="True" EnablePinchZooming="True"/>
       </chart:SfCartesianChart.ZoomPanBehavior>

       <chart:SfCartesianChart.XAxes>
           <chart:NumericalAxis/>
       </chart:SfCartesianChart.XAxes>

       <chart:SfCartesianChart.YAxes>
           <chart:NumericalAxis/>
       </chart:SfCartesianChart.YAxes>

       <chart:SfCartesianChart.Series>
            <chart:LineSeries ItemsSource="{Binding Data}" XBindingPath="XValue" YBindingPath="YValue1"/>
            <chart:LineSeries ItemsSource="{Binding Data}" XBindingPath="XValue" YBindingPath="YValue2"/>
        </chart:SfCartesianChart.Series>
</chart:SfCartesianChart>Constructors
SfCartesianChart()
Initializes a new instance of the SfCartesianChart class.
Declaration
public SfCartesianChart()Fields
AnnotationsProperty
Identifies the Annotations bindable property.
Declaration
public static readonly BindableProperty AnnotationsPropertyField Value
| Type | Description |
|---|---|
| Microsoft.Maui.Controls.BindableProperty | The identifier for Annotations bindable property. |
CrosshairBehaviorProperty
Identifies the CrosshairBehavior bindable property.
Declaration
public static readonly BindableProperty CrosshairBehaviorPropertyField Value
| Type | Description |
|---|---|
| Microsoft.Maui.Controls.BindableProperty | The identifier for CrosshairBehavior bindable property. |
EnableSideBySideSeriesPlacementProperty
Identifies the EnableSideBySideSeriesPlacement bindable property.
Declaration
public static readonly BindableProperty EnableSideBySideSeriesPlacementPropertyField Value
| Type | Description |
|---|---|
| Microsoft.Maui.Controls.BindableProperty | The identifier for EnableSideBySideSeriesPlacement bindable property. |
IsTransposedProperty
Identifies the IsTransposed bindable property.
Declaration
public static readonly BindableProperty IsTransposedPropertyField Value
| Type | Description |
|---|---|
| Microsoft.Maui.Controls.BindableProperty | The identifier for IsTransposed bindable property. |
PaletteBrushesProperty
Identifies the PaletteBrushes bindable property.
Declaration
public static readonly BindableProperty PaletteBrushesPropertyField Value
| Type | Description |
|---|---|
| Microsoft.Maui.Controls.BindableProperty | The identifier for PaletteBrushes bindable property. |
SelectionBehaviorProperty
Identifies the SelectionBehavior bindable property.
Declaration
public static readonly BindableProperty SelectionBehaviorPropertyField Value
| Type | Description |
|---|---|
| Microsoft.Maui.Controls.BindableProperty | The identifier for SelectionBehavior bindable property. |
SeriesProperty
Identifies the Series bindable property.
Declaration
public static readonly BindableProperty SeriesPropertyField Value
| Type | Description |
|---|---|
| Microsoft.Maui.Controls.BindableProperty | The identifier for Series bindable property. |
TrackballBehaviorProperty
Identifies the TrackballBehavior bindable property.
Declaration
public static readonly BindableProperty TrackballBehaviorPropertyField Value
| Type | Description |
|---|---|
| Microsoft.Maui.Controls.BindableProperty | The identifier for TrackballBehavior bindable property. |
ZoomPanBehaviorProperty
Identifies the ZoomPanBehavior bindable property.
Declaration
public static readonly BindableProperty ZoomPanBehaviorPropertyField Value
| Type | Description |
|---|---|
| Microsoft.Maui.Controls.BindableProperty | The identifier for ZoomPanBehavior bindable property. |
Properties
Annotations
Gets or sets a collection of annotations to the chart.
Declaration
public ChartAnnotationCollection Annotations { get; set; }Property Value
| Type | Description |
|---|---|
| ChartAnnotationCollection | This property takes aChartAnnotationCollection instance as a value, and its default value is null. |
Examples
    <chart:SfCartesianChart>

    <!-- ... Eliminated for simplicity-->
    <chart:SfCartesianChart.Annotations>
         <chart:VerticalLineAnnotation X1="1"/>
    </chart:SfCartesianChart.Annotations>

</chart:SfCartesianChart>CrosshairBehavior
Gets or sets a value for initiating crosshair, which displays the crosshair line and labels for the precise value inspection when you interact on the chart plot area.
Declaration
public ChartCrosshairBehavior CrosshairBehavior { get; set; }Property Value
| Type | Description |
|---|---|
| ChartCrosshairBehavior | This property takes a ChartCrosshairBehavior instance as a value, and its default value is null. |
Examples
<chart:SfCartesianChart>

    <chart:SfCartesianChart.XAxes>
        <chart:CategoryAxis ShowTrackballLabel = "True"/>
    </chart:SfCartesianChart.XAxes>

    <chart:SfCartesianChart.CrosshairBehavior>
        <chart:ChartCrosshairBehavior/>
    </chart:SfCartesianChart.CrosshairBehavior>

 <!--omitted for brevity-->

</chart:SfCartesianChart>EnableSideBySideSeriesPlacement
Gets or sets a System.Boolean value that indicates whether the series are placed side by side or overlapped.
Declaration
public bool EnableSideBySideSeriesPlacement { get; set; }Property Value
| Type | Description |
|---|---|
| System.Boolean | This proeprty takes the boolean value and its default value is |
Remarks
If the value is true, series placed side by side, else series rendered one over other(overlapped).
Examples
    <chart:SfCartesianChart EnableSideBySideSeriesPlacement = "True">

          <!-- ... Eliminated for simplicity-->

          <chart:SfCartesianChart.Series>
               <chart:LineSeries ItemsSource="{Binding Data}" XBindingPath="XValue" YBindingPath="YValue1"/>
          </chart:SfCartesianChart.Series>

</chart:SfCartesianChart>IsTransposed
Gets or sets a System.Boolean value that indicates whether to change the cartesian chart orientation.
Declaration
public bool IsTransposed { get; set; }Property Value
| Type | Description |
|---|---|
| System.Boolean | This proeprty takes the boolean value and its default value is |
Remarks
If the value is true, the orientation of x-axis is set to vertical and orientation of y-axis is set to horizontal.
Examples
    <chart:SfCartesianChart IsTransposed = "True">

          <!-- ... Eliminated for simplicity-->

          <chart:SfCartesianChart.Series>
               <chart:LineSeries ItemsSource="{Binding Data}" XBindingPath="XValue" YBindingPath="YValue1"/>
          </chart:SfCartesianChart.Series>

</chart:SfCartesianChart>PaletteBrushes
Gets or sets the palette brushes for chart.
Declaration
public IList<Brush> PaletteBrushes { get; set; }Property Value
| Type | Description |
|---|---|
| System.Collections.Generic.IList<Microsoft.Maui.Controls.Brush> | This property takes the list of Microsoft.Maui.Controls.Brush and its default value is predefined palette. |
Examples
    <chart:SfCartesianChart PaletteBrushes = "{Binding CustomBrushes}">

    <!-- ... Eliminated for simplicity-->

         <chart:ColumnSeries ItemsSource="{Binding Data}" XBindingPath="XValue" YBindingPath="YValue1" />\
         <chart:ColumnSeries ItemsSource="{Binding Data}" XBindingPath="XValue" YBindingPath="YValue2" />
         <chart:ColumnSeries ItemsSource="{Binding Data}" XBindingPath="XValue" YBindingPath="YValue3" />

</chart:SfCartesianChart>SelectionBehavior
Gets or sets a value for initiating selection or highlighting of a single or multiple series in the chart.
Declaration
public SeriesSelectionBehavior SelectionBehavior { get; set; }Property Value
| Type | Description |
|---|---|
| SeriesSelectionBehavior | This property takes a SeriesSelectionBehavior instance as a value, and its default value is null. |
Examples
<chart:SfCartesianChart>
        <chart:SfCartesianChart.XAxes>
            <chart:DateTimeAxis/>
        </chart:SfCartesianChart.XAxes>
        <chart:SfCartesianChart.YAxes>
            <chart:NumericalAxis/>
        </chart:SfCartesianChart.YAxes>
        <chart:SfCartesianChart.SelectionBehavior>
            <chart:SeriesSelectionBehavior/>
        </chart:SfCartesianChart.SelectionBehavior>
        <chart:ColumnSeries ItemsSource="{Binding Data}" XBindingPath="Date" YBindingPath="High"/>
        <chart:ColumnSeries ItemsSource="{Binding Data}" XBindingPath="Date" YBindingPath="Low"/>
</chart:SfCircularChart>Series
Gets or sets a collection of chart series to be added in cartesian chart.
Declaration
public ChartSeriesCollection Series { get; set; }Property Value
| Type | Description |
|---|---|
| ChartSeriesCollection | This property takes ChartSeriesCollection instance as value. |
Remarks
To render a series, create an instance of required series class, and add it to the Series collection.
Examples
    <chart:SfCartesianChart>

       <chart:SfCartesianChart.BindingContext>
           <local:ViewModel/>
       </chart:SfCartesianChart.BindingContext>

       <chart:SfCartesianChart.XAxes>
           <chart:NumericalAxis/>
       </chart:SfCartesianChart.XAxes>

       <chart:SfCartesianChart.YAxes>
           <chart:NumericalAxis/>
       </chart:SfCartesianChart.YAxes>

       <chart:SfCartesianChart.Series>
           <chart:LineSeries ItemsSource="{Binding Data}" XBindingPath="XValue" YBindingPath="YValue1"/>
           <chart:LineSeries ItemsSource="{Binding Data}" XBindingPath="XValue" YBindingPath="YValue2"/>
       </chart:SfCartesianChart.Series>

</chart:SfCartesianChart>TrackballBehavior
Gets or sets a value for initiating trackball, which displays the tooltip for the data points that are closer to the point where you interact on the chart area.
Declaration
public ChartTrackballBehavior TrackballBehavior { get; set; }Property Value
| Type | Description |
|---|---|
| ChartTrackballBehavior | This property takes aChartTrackballBehavior instance as a value, and its default value is null. |
Examples
    <chart:SfCartesianChart>

          <chart:SfCartesianChart.TrackballBehavior>
              <chart:ChartTrackballBehavior/>
          </chart:SfCartesianChart.TrackballBehavior>

</chart:SfCartesianChart>XAxes
Gets the collection of horizontal axes in the chart.
Declaration
public ObservableCollection<ChartAxis> XAxes { get; }Property Value
| Type | Description |
|---|---|
| System.Collections.ObjectModel.ObservableCollection<ChartAxis> | Returns the collection of ChartAxis. |
Remarks
Horizontal(X) axis supports the Category, Numeric and Date time.
Examples
<chart:SfCartesianChart>

        <chart:SfCartesianChart.BindingContext>
            <local:ViewModel/>
        </chart:SfCartesianChart.BindingContext>

        <chart:SfCartesianChart.XAxes>
            <chart:NumericalAxis/>
        </chart:SfCartesianChart.XAxes>

</chart:SfCartesianChart>YAxes
Gets the collection of vertical axes in the chart.
Declaration
public ObservableCollection<RangeAxisBase> YAxes { get; }Property Value
| Type | Description |
|---|---|
| System.Collections.ObjectModel.ObservableCollection<RangeAxisBase> | Returns the collection of RangeAxisBase. |
Remarks
Vertical(Y) axis always uses numerical scale.
Examples
<chart:SfCartesianChart>

        <chart:SfCartesianChart.BindingContext>
            <local:ViewModel/>
        </chart:SfCartesianChart.BindingContext>

        <chart:SfCartesianChart.YAxes>
            <chart:NumericalAxis/>
        </chart:SfCartesianChart.YAxes>

</chart:SfCartesianChart>ZoomPanBehavior
Gets or sets a value for initiating the zooming and panning operations in chart.
Declaration
public ChartZoomPanBehavior ZoomPanBehavior { get; set; }Property Value
| Type | Description |
|---|---|
| ChartZoomPanBehavior | This property takes the ChartZoomPanBehavior value and its default value is null. |
Examples
    <chart:SfCartesianChart>

          <chart:SfCartesianChart.BindingContext>
              <local:ViewModel/>
          </chart:SfCartesianChart.BindingContext>

          <chart:SfCartesianChart.ZoomPanBehavior>
              <chart:ChartZoomPanBehavior EnableDoubleTap="True" EnablePinchZooming="True" EnablePanning="True"/>
          </chart:SfCartesianChart.ZoomPanBehavior>

          <chart:SfCartesianChart.XAxes>
              <chart:NumericalAxis/>
          </chart:SfCartesianChart.XAxes>

          <chart:SfCartesianChart.YAxes>
              <chart:NumericalAxis/>
          </chart:SfCartesianChart.YAxes>

          <chart:SfCartesianChart.Series>
               <chart:LineSeries ItemsSource="{Binding Data}" XBindingPath="XValue" YBindingPath="YValue1"/>
          </chart:SfCartesianChart.Series>

</chart:SfCartesianChart>Methods
AnimateSeries()
Animates the visible series collection dynamically.
Declaration
public void AnimateSeries()OnBindingContextChanged()
Invoked when binding context changed.
Declaration
protected override void OnBindingContextChanged()Overrides
PointToValue(ChartAxis, Double, Double)
Returns a double value representing the data value that corresponds to the given point on the specified axis.
Declaration
public double PointToValue(ChartAxis axis, double x, double y)Parameters
| Type | Name | Description |
|---|---|---|
| ChartAxis | axis | The ChartAxis along which the conversion is performed. |
| System.Double | x | The x-coordinate of the point in pixels. |
| System.Double | y | The y-coordinate of the point in pixels. |
Returns
| Type | Description |
|---|---|
| System.Double | A double representing the corresponding data value along the specified ChartAxis. |
ResumeSeriesNotification()
Resumes collection change notification processing for all CartesianSeries in this SfCartesianChart. All changes buffered since the last SuspendSeriesNotification() call are applied at once, resulting in a single consolidated visual update.
Declaration
public void ResumeSeriesNotification()Remarks
If the SfCartesianChart is not currently suspended, this method has no effect.
Examples
SfCartesianChart chart = new SfCartesianChart();

NumericalAxis xAxis = new NumericalAxis();
NumericalAxis yAxis = new NumericalAxis();
chart.XAxes.Add(xAxis);
chart.YAxes.Add(yAxis);

FastLineSeries series1 = new FastLineSeries();
FastLineSeries series2 = new FastLineSeries();
ObservableCollection<DataModel> data1 = new ObservableCollection<DataModel>();
ObservableCollection<DataModel> data2 = new ObservableCollection<DataModel>();

series1.ItemsSource = data1;
series2.ItemsSource = data2;
chart.Series.Add(series1);
chart.Series.Add(series2);

chart.SuspendSeriesNotification();
try
{
    for (int i = 0; i < 1000; i++)
    {
        data1.Add(new DataModel { XValue = i, YValue = i * 10 });
        data2.Add(new DataModel { XValue = i, YValue = i * 20 });
    }
}
finally
{
    chart.ResumeSeriesNotification();
}
SuspendSeriesNotification()
Suspends collection change notification processing for all CartesianSeries in this SfCartesianChart. Data source changes made while suspended are buffered and applied in a single consolidated update when ResumeSeriesNotification() is called.
Declaration
public void SuspendSeriesNotification()Remarks
Calling this method multiple times has no additional effect after the first call.
Use this to batch large data updates across all series without triggering a render cycle for every individual change.
Examples
SfCartesianChart chart = new SfCartesianChart();

NumericalAxis xAxis = new NumericalAxis();
NumericalAxis yAxis = new NumericalAxis();
chart.XAxes.Add(xAxis);
chart.YAxes.Add(yAxis);

FastLineSeries series1 = new FastLineSeries();
FastLineSeries series2 = new FastLineSeries();
ObservableCollection<DataModel> data1 = new ObservableCollection<DataModel>();
ObservableCollection<DataModel> data2 = new ObservableCollection<DataModel>();

series1.ItemsSource = data1;
series2.ItemsSource = data2;
chart.Series.Add(series1);
chart.Series.Add(series2);

chart.SuspendSeriesNotification();
try
{
    for (int i = 0; i < 1000; i++)
    {
        data1.Add(new DataModel { XValue = i, YValue = i * 10 });
        data2.Add(new DataModel { XValue = i, YValue = i * 20 });
    }
}
finally
{
    chart.ResumeSeriesNotification();
}
ValueToPoint(ChartAxis, Double)
Return a float value that representing the point value that corresponds to the given data value on the specified axis.
Declaration
public float ValueToPoint(ChartAxis axis, double value)Parameters
| Type | Name | Description |
|---|---|---|
| ChartAxis | axis | The ChartAxis along which the conversion is performed. |
| System.Double | value | The data value to convert to a point coordinate. |
Returns
| Type | Description |
|---|---|
| System.Single | A float representing the point coordinate in pixels. |
Events
AnnotationTapped
This event is triggered when an annotation is tapped.
Declaration
public event EventHandler<AnnotationTappedEventArgs> AnnotationTappedEvent Type
| Type |
|---|
| System.EventHandler<AnnotationTappedEventArgs> |
AxisLabelTapped
This event is triggered when an axis label is tapped.
Declaration
public event EventHandler<AxisLabelTappedEventArgs> AxisLabelTappedEvent Type
| Type |
|---|
| System.EventHandler<AxisLabelTappedEventArgs> |
Remarks
This event is raised when a user taps on an axis label in the chart. The event arguments provide details about which axis and label were tapped, as well as the tap position.
DataLabelTapped
This event is triggered when a data label is tapped.
Declaration
public event EventHandler<DataLabelTappedEventArgs> DataLabelTappedEvent Type
| Type |
|---|
| System.EventHandler<DataLabelTappedEventArgs> |
Remarks
This event is raised when a user taps on a data label in the chart. The event arguments provide details about which series, data point, and label were tapped, as well as the tap position and optional segment information.
ResetZoom
This event is triggered when reset the chart.
Declaration
public event EventHandler<ChartResetZoomEventArgs> ResetZoomEvent Type
| Type |
|---|
| System.EventHandler<ChartResetZoomEventArgs> |
Scroll
This event is triggered when panning the chart.
Declaration
public event EventHandler<ChartScrollEventArgs> ScrollEvent Type
| Type |
|---|
| System.EventHandler<ChartScrollEventArgs> |
SelectionZoomDelta
This event is triggered during the process of selection zooming.
Declaration
public event EventHandler<ChartSelectionZoomDeltaEventArgs> SelectionZoomDeltaEvent Type
| Type |
|---|
| System.EventHandler<ChartSelectionZoomDeltaEventArgs> |
SelectionZoomEnd
This event is triggered when a selection zoom action concludes.
Declaration
public event EventHandler<ChartSelectionZoomEventArgs> SelectionZoomEndEvent Type
| Type |
|---|
| System.EventHandler<ChartSelectionZoomEventArgs> |
SelectionZoomStart
This event is triggered when a selection zoom action begins.
Declaration
public event EventHandler<ChartSelectionZoomEventArgs> SelectionZoomStartEvent Type
| Type |
|---|
| System.EventHandler<ChartSelectionZoomEventArgs> |
TrackballCreated
This event is raised when the trackball is moved from one data point to another. This helps to customize the trackball label and marker based on the condition.
Declaration
public event EventHandler<TrackballEventArgs> TrackballCreatedEvent Type
| Type |
|---|
| System.EventHandler<TrackballEventArgs> |
ZoomDelta
This event is triggered during the zooming process.
Declaration
public event EventHandler<ChartZoomDeltaEventArgs> ZoomDeltaEvent Type
| Type |
|---|
| System.EventHandler<ChartZoomDeltaEventArgs> |
ZoomEnd
This event is triggered when zooming concludes.
Declaration
public event EventHandler<ChartZoomEventArgs> ZoomEndEvent Type
| Type |
|---|
| System.EventHandler<ChartZoomEventArgs> |
ZoomStart
This event is triggered when zooming begins.
Declaration
public event EventHandler<ChartZoomStartEventArgs> ZoomStartEvent Type
| Type |
|---|
| System.EventHandler<ChartZoomStartEventArgs> |