Line Chart in .NET MAUI Cartesian Chart
10 Jul 202614 minutes to read
Line Chart
A line chart is used to represent the data trends at equal intervals by connecting points on a plot with straight lines. To render a line chart, create an instance of LineSeries and add it to the Series collection property of SfCartesianChart.
NOTE
Prerequisite: Ensure that the required NuGet package is installed, the necessary namespaces are imported, and the SfCartesianChart control is properly configured in your application. For detailed setup and configuration instructions, refer to the Getting Started guide.
NOTE
The Cartesian chart has Series as its default content.
<chart:SfCartesianChart>
    <chart:SfCartesianChart.XAxes>
        <chart:CategoryAxis/>
    </chart:SfCartesianChart.XAxes>

    <chart:SfCartesianChart.YAxes>
        <chart:NumericalAxis/>
    </chart:SfCartesianChart.YAxes>

    <chart:LineSeries ItemsSource="{Binding Data}"
                      XBindingPath="Demand"
                      YBindingPath="Year2010"/>
    <chart:LineSeries ItemsSource="{Binding Data}"
                      XBindingPath="Demand"
                      YBindingPath="Year2011"/>
</chart:SfCartesianChart>
SfCartesianChart chart = new SfCartesianChart();
CategoryAxis primaryAxis = new CategoryAxis();
chart.XAxes.Add(primaryAxis);
NumericalAxis secondaryAxis = new NumericalAxis();
chart.YAxes.Add(secondaryAxis);
LineSeries series1 = new LineSeries()
{
ItemsSource = new ViewModel().Data,
XBindingPath = "Demand",
YBindingPath = "Year2010",
};
LineSeries series2 = new LineSeries()
{
ItemsSource = new ViewModel().Data,
XBindingPath = "Demand",
YBindingPath = "Year2011",
};
chart.Series.Add(series1);
chart.Series.Add(series2);
this.Content = chart;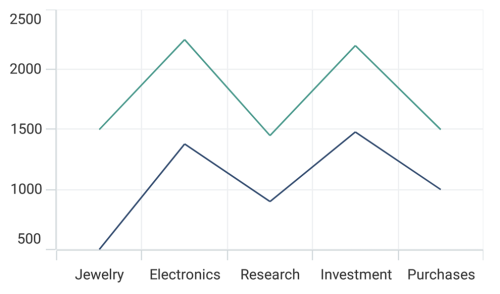
Dashed line
The StrokeDashArray property of LineSeries, of type DoubleCollection, is used to render the line series with dashes. Values at odd indices define the dash length, while values at even indices define the gap.
<chart:SfCartesianChart>
    <chart:SfCartesianChart.Resources>
        <DoubleCollection x:Key="dashArray">
            <x:Double>5</x:Double>
            <x:Double>2</x:Double>
        </DoubleCollection>
    </chart:SfCartesianChart.Resources>

    <chart:SfCartesianChart.XAxes>
        <chart:CategoryAxis/>
    </chart:SfCartesianChart.XAxes>

    <chart:SfCartesianChart.YAxes>
        <chart:NumericalAxis/>
    </chart:SfCartesianChart.YAxes>

    <chart:LineSeries ItemsSource="{Binding Data}"
                      XBindingPath="Demand"
                      YBindingPath="Year2010"
                      StrokeDashArray="{StaticResource dashArray}"/>
    <chart:LineSeries ItemsSource="{Binding Data}"
                      XBindingPath="Demand"
                      YBindingPath="Year2011"
                      StrokeDashArray="{StaticResource dashArray}"/>
</chart:SfCartesianChart>
SfCartesianChart chart = new SfCartesianChart();
//code omitted for brevity
DoubleCollection doubleCollection = new DoubleCollection();
doubleCollection.Add(5);
doubleCollection.Add(2);
CategoryAxis primaryAxis = new CategoryAxis();
chart.XAxes.Add(primaryAxis);
NumericalAxis secondaryAxis = new NumericalAxis();
chart.YAxes.Add(secondaryAxis);
LineSeries series1 = new LineSeries()
{
ItemsSource = new ViewModel().Data,
XBindingPath = "Demand",
YBindingPath = "Year2010",
StrokeDashArray = doubleCollection,
};
LineSeries series2 = new LineSeries()
{
ItemsSource = new ViewModel().Data,
XBindingPath = "Demand",
YBindingPath = "Year2011",
StrokeDashArray = doubleCollection
};
chart.Series.Add(series1);
chart.Series.Add(series2);
this.Content = chart;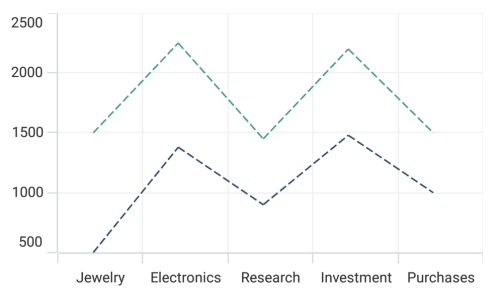
Spline Chart
The SplineSeries resembles the line series, but instead of connecting the data points with line segments, the data points are connected by smooth bezier curves. It supports the same marker and customization options as LineSeries.
<chart:SfCartesianChart>
    <chart:SfCartesianChart.XAxes>
        <chart:CategoryAxis/>
    </chart:SfCartesianChart.XAxes>

    <chart:SfCartesianChart.YAxes>
        <chart:NumericalAxis/>
    </chart:SfCartesianChart.YAxes>

    <chart:SplineSeries ItemsSource="{Binding Data}"
                        XBindingPath="Demand"
                        YBindingPath="Year2010"/>
    <chart:SplineSeries ItemsSource="{Binding Data}"
                        XBindingPath="Demand"
                        YBindingPath="Year2011"/>
</chart:SfCartesianChart>
SfCartesianChart chart = new SfCartesianChart();
CategoryAxis primaryAxis = new CategoryAxis();
chart.XAxes.Add(primaryAxis);
NumericalAxis secondaryAxis = new NumericalAxis();
chart.YAxes.Add(secondaryAxis);
SplineSeries series1 = new SplineSeries()
{
ItemsSource = new ViewModel().Data,
XBindingPath = "Demand",
YBindingPath = "Year2010",
};
SplineSeries series2 = new SplineSeries()
{
ItemsSource = new ViewModel().Data,
XBindingPath = "Demand",
YBindingPath = "Year2011",
};
chart.Series.Add(series1);
chart.Series.Add(series2);
this.Content = chart;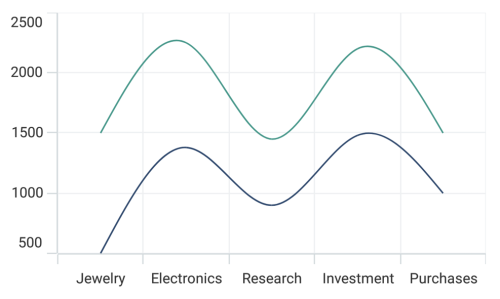
Spline rendering types
The Type property allows you to change the rendering type of the spline curve in the series. The default value of Type is Natural.
The following types are used in SplineSeries:
NaturalMonotonicCardinalClamped
<chart:SfCartesianChart>
    <chart:SfCartesianChart.XAxes>
        <chart:CategoryAxis/>
    </chart:SfCartesianChart.XAxes>

    <chart:SfCartesianChart.YAxes>
        <chart:NumericalAxis/>
    </chart:SfCartesianChart.YAxes>

    <chart:SplineSeries ItemsSource="{Binding Data}"
                        XBindingPath="Demand"
                        YBindingPath="Year2010"
                        Type="Cardinal"/>
</chart:SfCartesianChart>
SfCartesianChart chart = new SfCartesianChart();
CategoryAxis primaryAxis = new CategoryAxis();
chart.XAxes.Add(primaryAxis);
NumericalAxis secondaryAxis = new NumericalAxis();
chart.YAxes.Add(secondaryAxis);
SplineSeries series = new SplineSeries()
{
ItemsSource = new ViewModel().Data,
XBindingPath = "Demand",
YBindingPath = "Year2010",
Type = SplineType.Cardinal,
};
chart.Series.Add(series);
this.Content = chart;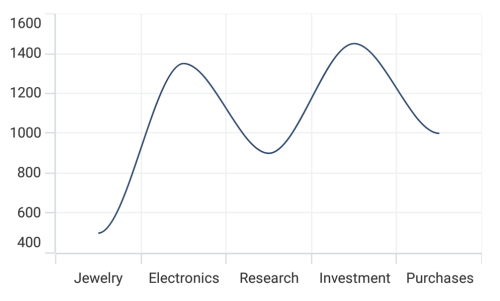
Enable Marker
A marker, also known as a symbol, is used to determine or highlight the position of the data point. To enable markers in the series, set the ShowMarkers property to true.
<chart:SfCartesianChart>
    <!-- code omitted for brevity -->
    <chart:LineSeries ItemsSource="{Binding Data}"
                      XBindingPath="Demand"
                      YBindingPath="Year2010"
                      ShowMarkers="True"/>

    <chart:LineSeries ItemsSource="{Binding Data}"
                      XBindingPath="Demand"
                      YBindingPath="Year2011"
                      ShowMarkers="True"/>
</chart:SfCartesianChart>
SfCartesianChart chart = new SfCartesianChart();
//code omitted for brevity
LineSeries series1 = new LineSeries()
{
ItemsSource = new ViewModel().Data,
XBindingPath = "Demand",
YBindingPath = "Year2010",
ShowMarkers = true,
};
LineSeries series2 = new LineSeries()
{
ItemsSource = new ViewModel().Data,
XBindingPath = "Demand",
YBindingPath = "Year2011",
ShowMarkers = true,
};
chart.Series.Add(series1);
chart.Series.Add(series2);
this.Content = chart;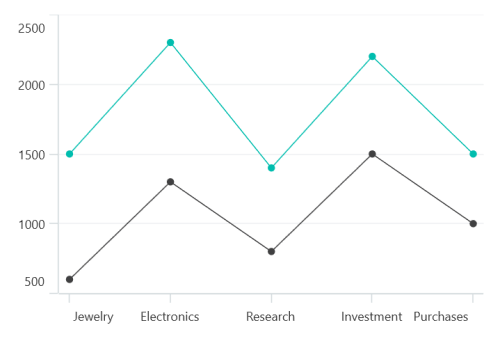
Marker customization
To change the series marker appearance, set the MarkerSettings property to a new instance of ChartMarkerSettings. The following properties are used to customize marker appearance.
-
Type, of type
ShapeType, describes the shape of the series marker. The default value of this property is ShapeType.Circle. -
Stroke, of type
Brush, indicates the brush used to paint the marker border. -
StrokeWidth, of type
double, indicates the width of the marker border. -
Fill, of type
Brush, indicates the color of the marker. -
Width, of type
double, indicates the width of the marker. -
Height, of type
double, indicates the height of the marker.
<chart:SfCartesianChart>
    <!-- code omitted for brevity -->
    <chart:LineSeries ItemsSource="{Binding Data}"
                      XBindingPath="Demand"
                      YBindingPath="Year2010"
                      ShowMarkers="True">
        <chart:LineSeries.MarkerSettings>
            <chart:ChartMarkerSettings Type="Diamond"
                                       Fill="Brown"
                                       Stroke="Black"
                                       StrokeWidth="1"
                                       Height="8"
                                       Width="8"/>
        </chart:LineSeries.MarkerSettings>
    </chart:LineSeries>
</chart:SfCartesianChart>
SfCartesianChart chart = new SfCartesianChart();
//code omitted for brevity
ChartMarkerSettings chartMarker = new ChartMarkerSettings()
{
Type = ShapeType.Diamond,
Fill = Colors.Brown,
Stroke = Colors.Black,
StrokeWidth = 1,
Height = 8,
Width = 8
};
LineSeries series = new LineSeries()
{
ItemsSource = new ViewModel().Data,
XBindingPath = "Demand",
YBindingPath = "Year2010",
ShowMarkers = true,
MarkerSettings = chartMarker,
};
chart.Series.Add(series);
this.Content = chart;