Waterfall Chart in .NET MAUI Cartesian Chart
10 Jul 20265 minutes to read
Waterfall chart
WaterfallSeries clarifies the cumulative effect of a set of provided positive and negative values. The series is represented by a rectangle and a connector between the rectangles. To render a waterfall chart, create an instance of WaterfallSeries, and add it to the Series collection property of the SfCartesianChart.
The following properties customize the waterfall series:
-
SummaryBindingPath, of type
string, is used to get or set the path value on the source subject to serve summary values to the series. -
SummaryPointsBrush, of type
Brush, is used to change the fill of the summary segment of the series. -
NegativePointsBrush, of type
Brush, is used to change the fill of the negative segment of the series. -
AllowAutoSum, of type
bool, is used to change the summary segment calculation. The default value istrue. When this property is disabled, the segment is rendered using the y value of the provided ItemsSource collection. -
ShowConnectorLine, of type
bool, is used to enable or disable the connector line. The default value istrue.
NOTE
Prerequisite: Ensure that the required NuGet package is installed, the necessary namespaces are imported, and the SfCartesianChart control is properly configured in your application. For detailed setup and configuration instructions, refer to the Getting Started guide.
<chart:SfCartesianChart>
    <chart:SfCartesianChart.XAxes>
        <chart:CategoryAxis/>
    </chart:SfCartesianChart.XAxes>

    <chart:SfCartesianChart.YAxes>
        <chart:NumericalAxis/>
    </chart:SfCartesianChart.YAxes>

    <chart:SfCartesianChart.Series>
        <chart:WaterfallSeries ItemsSource="{Binding Sales}"
                               XBindingPath="Department"
                               YBindingPath="Value"
                               AllowAutoSum="True"
                               NegativePointsBrush="Red"
                               SummaryBindingPath="IsSummary"
                               SummaryPointsBrush="RoyalBlue"
                               ShowConnectorLine="True"/>
    </chart:SfCartesianChart.Series>
</chart:SfCartesianChart>
SfCartesianChart chart = new SfCartesianChart();
CategoryAxis xAxis = new CategoryAxis();
NumericalAxis yAxis = new NumericalAxis();
chart.XAxes.Add(xAxis);
chart.YAxes.Add(yAxis);
ViewModel viewModel = new ViewModel();
WaterfallSeries series = new WaterfallSeries()
{
ItemsSource = new viewModel().Sales,
XBindingPath = "Department",
YBindingPath = "Value",
AllowAutoSum = true,
NegativePointsBrush = new SolidColorBrush(Colors.Red),
SummaryBindingPath = "IsSummary",
SummaryPointsBrush = new SolidColorBrush(Colors.RoyalBlue),
ShowConnectorLine = true,
};
chart.Series.Add(series);
this.Content = chart;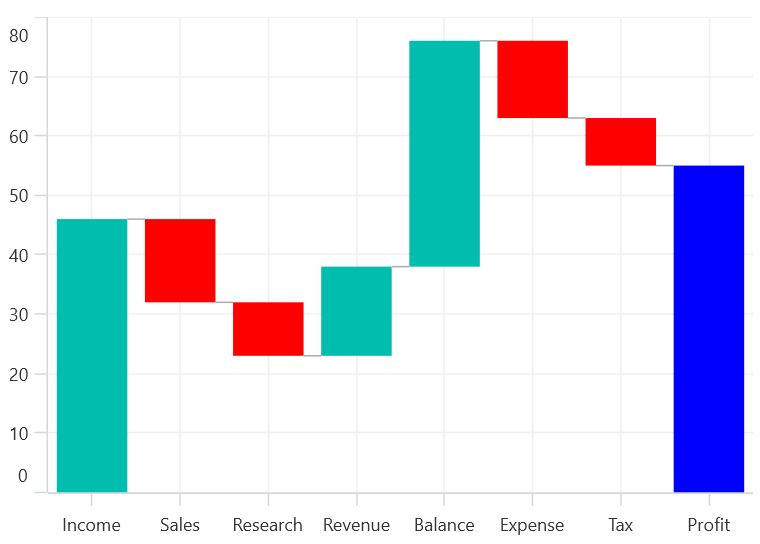
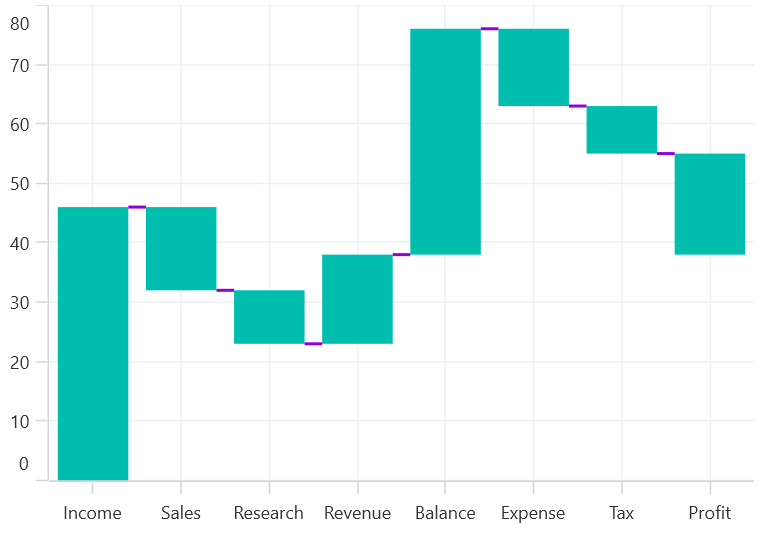
Connector line customization
The connector line can be customized by applying the ConnectorLineStyle property of the series.
The following code example illustrates how to apply style for connector line.
<chart:SfCartesianChart.Series>
    <chart:WaterfallSeries ItemsSource="{Binding Sales}"
                           XBindingPath="Department"
                           YBindingPath="Value">
        <chart:WaterfallSeries.ConnectorLineStyle>
                <chart:ChartLineStyle Stroke="DarkViolet" StrokeWidth="2"/>
        </chart:WaterfallSeries.ConnectorLineStyle>
    </chart:WaterfallSeries>
</chart:SfCartesianChart.Series>
ChartLineStyle lineStyle = new ChartLineStyle()
{
Stroke = new SolidColorBrush(Colors.DarkViolet),
StrokeThickness = 2
};
WaterfallSeries series = new WaterfallSeries()
{
ItemsSource = new viewModel().Sales,
XBindingPath = "Department",
YBindingPath = "Value",
ConnectorLineStyle = lineStyle,
};
chart.Series.Add(series);