Bar Chart in .NET MAUI Cartesian Chart
10 Jul 20264 minutes to read
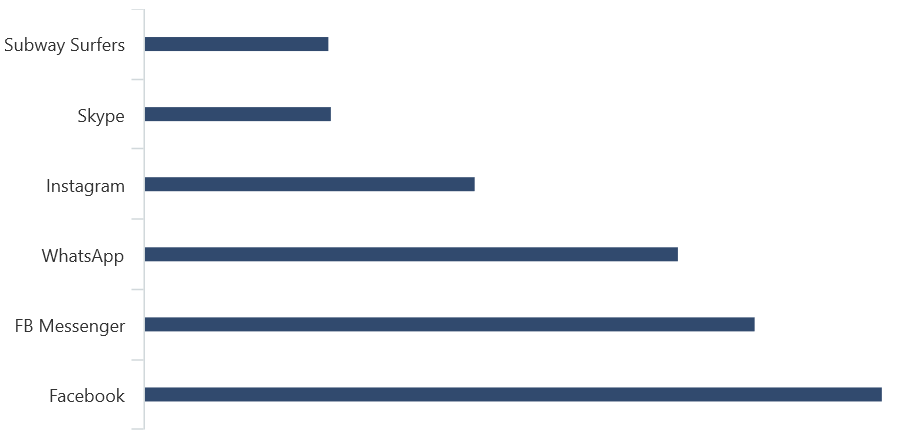
A bar chart uses bars to represent data points and compare values across different categories. To render a bar chart, initialize the SfCartesianChart and set the IsTransposed property to true to switch the chart’s X and Y axes. Then, create a ColumnSeries and add it to the Series collection property of SfCartesianChart. For more information on column chart setup, see the Column Chart documentation.
NOTE
By default, the IsTransposed property of the SfCartesianChart is
false.
NOTE
The Cartesian chart has
Seriesas its default content.
NOTE
Prerequisite: Ensure that the required NuGet package is installed, the necessary namespaces are imported, and the SfCartesianChart control is properly configured in your application. For detailed setup and configuration instructions, refer to the Getting Started guide.
<chart:SfCartesianChart IsTransposed="True">

    <chart:SfCartesianChart.XAxes>
        <chart:CategoryAxis/>
    </chart:SfCartesianChart.XAxes>

    <chart:SfCartesianChart.YAxes>
        <chart:NumericalAxis/>
    </chart:SfCartesianChart.YAxes>

    <chart:ColumnSeries ItemsSource="{Binding Data}"
                        XBindingPath="XValue"
                        YBindingPath="YValue"/>

</chart:SfCartesianChart>
SfCartesianChart chart = new SfCartesianChart();
chart.IsTransposed = true;
CategoryAxis primaryAxis = new CategoryAxis();
chart.XAxes.Add(primaryAxis);
NumericalAxis secondaryAxis = new NumericalAxis();
chart.YAxes.Add(secondaryAxis);
ColumnSeries series = new ColumnSeries()
{
ItemsSource = new ViewModel().Data,
XBindingPath = "XValue",
YBindingPath = "YValue",
};
chart.Series.Add(series);
this.Content = chart;
Spacing and Width
The Spacing property of the ColumnSeries is used to change the spacing between two segments. The default value of the spacing is 0, and the value ranges from 0 to 1. Here, 1 and 0 correspond to 100% and 0% of the available space, respectively.
The Width property of the ColumnSeries is used to change the width of the rectangle. The default value of the width is 0.8, and the value ranges from 0 to 1.
<chart:SfCartesianChart IsTransposed="True">

    <chart:SfCartesianChart.XAxes>
        <chart:CategoryAxis/>
    </chart:SfCartesianChart.XAxes>

    <chart:SfCartesianChart.YAxes>
        <chart:NumericalAxis/>
    </chart:SfCartesianChart.YAxes>

    <chart:ColumnSeries ItemsSource="{Binding Data}"
                        XBindingPath="XValue"
                        YBindingPath="YValue"
                        Spacing="0.3"
                        Width="0.5"/>

</chart:SfCartesianChart>
SfCartesianChart chart = new SfCartesianChart();
chart.IsTransposed = true;
CategoryAxis primaryAxis = new CategoryAxis();
chart.XAxes.Add(primaryAxis);
NumericalAxis secondaryAxis = new NumericalAxis();
chart.YAxes.Add(secondaryAxis);
ColumnSeries series = new ColumnSeries()
{
ItemsSource = new ViewModel().Data,
XBindingPath = "XValue",
YBindingPath = "YValue",
Spacing = 0.3,
Width = 0.5
};
chart.Series.Add(series);
this.Content = chart;