Plot band in .NET MAUI Cartesian Chart
10 Jul 202624 minutes to read
A plot band, also known as a stripline, allows for shading specific regions or ranges in the plot area background at regular or custom intervals. It also provides options to customize the size of these bands. Text can be added to plot band and indicate the significance of each particular region.
NOTE
Prerequisite: Ensure that the required NuGet package is installed, the necessary namespaces are imported, and the SfCartesianChart control is properly configured in your application. For detailed setup and configuration instructions, refer to the Getting Started guide.
Plot bands are classified into NumericalPlotBand and DateTimePlotBand. Based on the axis, plot bands are drawn using these classifications. The following properties are used to configure the plot band:
-
Size- changes how long plot band should be expanded. This is applicable only when end is not specified. -
SizeType- changes the date-time unit of the value specified in theSizeproperty. The values can be year, month, day, hour, minute, second, and millisecond. -
Text- changes the text of the plot band. -
Fill- changes the fill of the plot band. -
Stroke- changes the stroke color of the plot band. -
StrokeWidth- changes the stroke width of the plot band. -
StrokeDashArray- changes the stoke in dash array. -
IsVisible- changes the visibility of the plot band in chart axis. -
IsRepeatable- specifies the plot band need to be repeated in specified interval.
Numerical PlotBand
NumericalPlotBands are used to draw plot bands for NumericalAxis, CategoryAxis, and DateTimeCategoryAxis. To add a plot band, create an instance of NumericalPlotBandCollection and specify numerical value for the Start and End parameter. These parameters determine the beginning and end of the plot band.
<chart:SfCartesianChart>
    <!-- code omitted for brevity -->
    <chart:SfCartesianChart.YAxes>
        <chart:NumericalAxis>
            <chart:NumericalAxis.PlotBands>
                <chart:NumericalPlotBandCollection>
                    <chart:NumericalPlotBand Start="24" End="28"
                                             Fill="Orange"/>
                </chart:NumericalPlotBandCollection>
            </chart:NumericalAxis.PlotBands>
        </chart:NumericalAxis>
    </chart:SfCartesianChart.YAxes>
    <!-- code omitted for brevity -->
</chart:SfCartesianChart>
SfCartesianChart chart = new SfCartesianChart();
//code omitted for brevity
NumericalAxis numericalAxis = new NumericalAxis();
NumericalPlotBandCollection numericalPlotBandCollection = new NumericalPlotBandCollection();
NumericalPlotBand plotBand = new NumericalPlotBand
{
Start = 24,
End = 28,
Fill = Colors.Orange
};
numericalPlotBandCollection.Add(plotBand);
numericalAxis.PlotBands = numericalPlotBandCollection;
chart.YAxes.Add(numericalAxis);
//code omitted for brevity
this.Content = chart;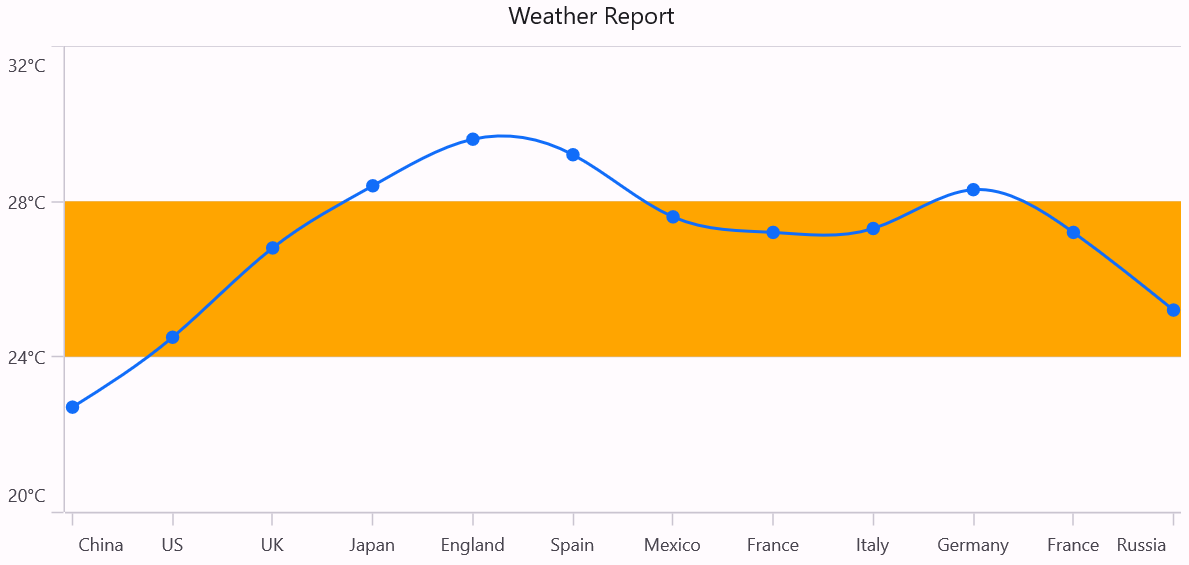
DateTime PlotBand
DateTimePlotBands are used to draw plot bands for DateTimeAxis. To add a plot band, create an instance of DateTimePlotBandCollection and specifying the Start date and End date. These parameters determine the beginning and end of the plot band.
<chart:SfCartesianChart>
    <!-- code omitted for brevity -->
    <chart:SfCartesianChart.XAxes>
        <chart:DateTimeAxis>
            <chart:DateTimeAxis.PlotBands>
                <chart:DateTimePlotBandCollection>
                    <chart:DateTimePlotBand Start="2023-04-01"
                                            End="2023-06-01"
                                            Fill="Orange"/>
                </chart:DateTimePlotBandCollection>
            </chart:DateTimeAxis.PlotBands>
        </chart:DateTimeAxis>
    </chart:SfCartesianChart.XAxes>

    <chart:SfCartesianChart.YAxes>
        <chart:NumericalAxis/>
    </chart:SfCartesianChart.YAxes>
</chart:SfCartesianChart>
SfCartesianChart chart = new SfCartesianChart();
//code omitted for brevity
DateTimeAxis dateTimeAxis = new DateTimeAxis();
DateTimePlotBandCollection dateTimePlotBandCollection = new DateTimePlotBandCollection();
DateTimePlotBand plotBand = new DateTimePlotBand
{
Start = new DateTime(2023, 04, 01),
End = new DateTime(2023,06,01),
Fill = Colors.Orange
};
dateTimePlotBandCollection.Add(plotBand);
dateTimeAxis.PlotBands = dateTimePlotBandCollection;
chart.XAxes.Add(dateTimeAxis);
NumericalAxis secondaryAxis = new NumericalAxis();
chart.YAxes.Add(secondaryAxis);
//code omitted for brevity
this.Content = chart;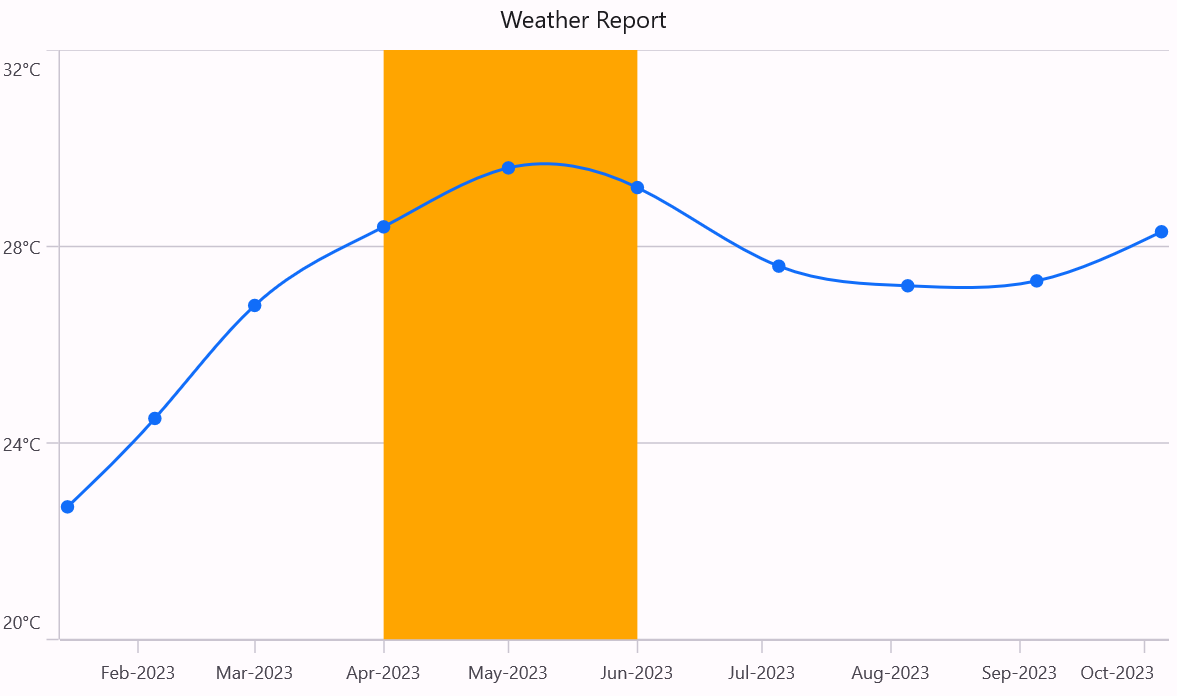
Recursive plot band
The Plot band recurrence feature enables plot bands to be drawn repeatedly at regular intervals. This functionality is particularly useful when you need to mark events that occur recursively along the timeline of the chart.
-
RepeatEvery- Specifies the frequency at which the plot band is repeated. -
RepeatEveryType- Specifies the date time unit forDateTimePlotBand. -
RepeatUntil- Specifies the end value at which the plot band stops repeating.
<chart:SfCartesianChart>
    <!-- code omitted for brevity -->
    <chart:SfCartesianChart.XAxes>
        <chart:CategoryAxis/>
    </chart:SfCartesianChart.XAxes>

    <chart:SfCartesianChart.YAxes>
        <chart:NumericalAxis>
            <chart:NumericalAxis.PlotBands>
                <chart:NumericalPlotBandCollection>
                    <chart:NumericalPlotBand Start="20" End="22"
                                             IsRepeatable="True"
                                             RepeatUntil="32"
                                             RepeatEvery="4"
                                             Fill="LightGray"/>
                </chart:NumericalPlotBandCollection>
            </chart:NumericalAxis.PlotBands>
        </chart:NumericalAxis>
    </chart:SfCartesianChart.YAxes>
</chart:SfCartesianChart>
SfCartesianChart chart = new SfCartesianChart();
//code omitted for brevity
CategoryAxis primaryAxis = new CategoryAxis();
chart.XAxes.Add(primaryAxis);
NumericalAxis numericalAxis = new NumericalAxis();
NumericalPlotBandCollection numericalPlotBandCollection = new NumericalPlotBandCollection();
NumericalPlotBand plotBand = new NumericalPlotBand
{
Start = 20,
End = 22,
IsRepeatable = true,
RepeatUntil = 32,
RepeatEvery = 4,
Fill = Colors.LightGray
};
numericalPlotBandCollection.Add(plotBand);
numericalAxis.PlotBands = numericalPlotBandCollection;
chart.YAxes.Add(numericalAxis);
//code omitted for brevity
this.Content = chart;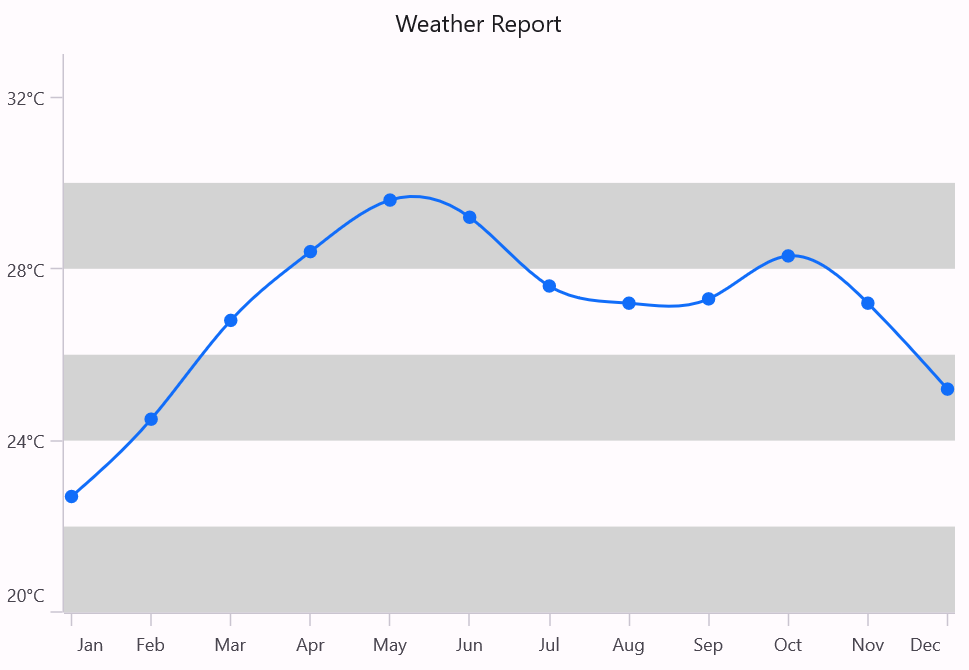
Segmented plot band
Typically, if you draw a plot band for a vertical axis, the height of the plot band is determined by the start and end properties. The end of the plot band is equivalent to the end of its associated horizontal axis, meaning the plot band is drawn horizontally across the entire stretch of its associated horizontal axis. Similarly, for a horizontal axis, the width is determined by the start and width properties. Vertically, it is drawn across the entire stretch of the associated vertical axis
Suppose, you want to draw a plot band that should not stretch along its associated axis, you have to set AssociatedAxisStart and AssociatedAxisEnd properties. The values provided in these two properties correspond to its associated axis specified by AssociatedAxisName property.
<chart:SfCartesianChart>
    <!-- code omitted for brevity -->
    <chart:SfCartesianChart.XAxes>
       <chart:CategoryAxis/>
     </chart:SfCartesianChart.XAxes>

    <chart:SfCartesianChart.YAxes>
        <chart:NumericalAxis>
            <chart:NumericalAxis.PlotBands>
                <chart:NumericalPlotBandCollection>
                    <chart:NumericalPlotBand Start="20"
                                             End="22"
                                             AssociatedAxisEnd="2"
                                             Fill="#B300E190"
                                             Text="Low"/>

                    <chart:NumericalPlotBand Start="25"
                                             End="27"
                                             AssociatedAxisStart="4.3"
                                             AssociatedAxisEnd="6.8"
                                             Fill="#B3FCD404"
                                             Text="Average"/>

                    <chart:NumericalPlotBand Start="30"
                                             End="32"
                                             AssociatedAxisStart="9"
                                             Fill="#B3FF4E4E"
                                             Text="High"/>
                </chart:NumericalPlotBandCollection>
            </chart:NumericalAxis.PlotBands>
        </chart:NumericalAxis>
    </chart:SfCartesianChart.YAxes>
    <!-- code omitted for brevity -->
</chart:SfCartesianChart>
SfCartesianChart chart = new SfCartesianChart();
//code omitted for brevity
CategoryAxis primaryAxis = new CategoryAxis();
chart.XAxes.Add(primaryAxis);
NumericalAxis numericalAxis = new NumericalAxis();
NumericalPlotBandCollection numericalPlotBandCollection = new NumericalPlotBandCollection();
NumericalPlotBand plotBand1 = new NumericalPlotBand()
{
Start = 20,
End = 22,
AssociatedAxisEnd = 2,
Text = "Low",
Fill = new SolidColorBrush(Color.FromArgb("#B300E190"))
};
NumericalPlotBand plotBand2 = new NumericalPlotBand()
{
Start = 25,
End = 27,
AssociatedAxisStart = 4.3,
AssociatedAxisEnd = 6.8,
Text = "Average",
Fill = new SolidColorBrush(Color.FromArgb("#B3FCD404"))
};
NumericalPlotBand plotBand3 = new NumericalPlotBand()
{
Start = 30,
End = 32,
AssociatedAxisStart = 9,
Text = "High",
Fill = new SolidColorBrush(Color.FromArgb("#B3FF4E4E"))
};
numericalPlotBandCollection.Add(plotBand1);
numericalPlotBandCollection.Add(plotBand2);
numericalPlotBandCollection.Add(plotBand3);
numericalAxis.PlotBands = numericalPlotBandCollection;
chart.YAxes.Add(numericalAxis);
//code omitted for brevity
this.Content = chart;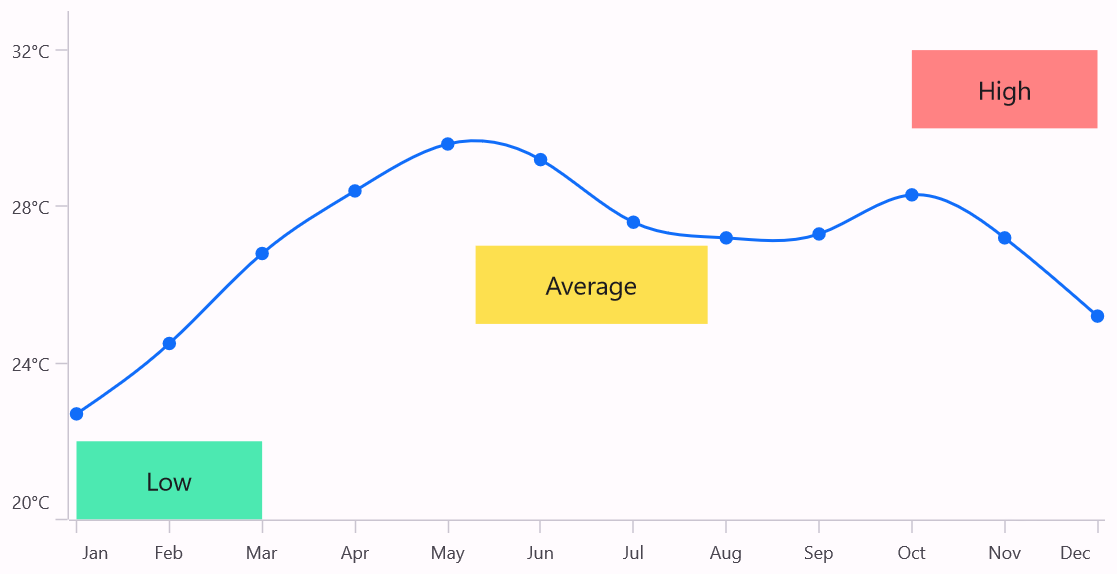
Plot Line
When specifying the same value for both start and end, a plot line will be drawn.
<chart:SfCartesianChart>
    <!-- code omitted for brevity -->
      <chart:SfCartesianChart.XAxes>
       <chart:CategoryAxis/>
     </chart:SfCartesianChart.XAxes>

    <chart:SfCartesianChart.YAxes>
        <chart:NumericalAxis>
            <chart:NumericalAxis.PlotBands>
                <chart:NumericalPlotBandCollection>
                    <chart:NumericalPlotBand Start="24"
                                             End="24"
                                             Fill="#B300E190"
                                             Stroke="#B300E190"
                                             StrokeWidth="2"
                                             Text="Low Temperature"/>

                    <chart:NumericalPlotBand Start="28"
                                             End="28"
                                             Stroke="#FCD404"
                                             StrokeWidth="2"
                                             Fill="#FCD404"
                                             Text="Average Temperature"/>

                    <chart:NumericalPlotBand Start="32"
                                             End="32"
                                             Stroke="#FF4E4E"
                                             StrokeWidth="2"
                                             Fill="#FF4E4E"
                                            Text="High Temperature"/>
                </chart:NumericalPlotBandCollection>
            </chart:NumericalAxis.PlotBands>
        </chart:NumericalAxis>
    </chart:SfCartesianChart.YAxes>
    <!-- code omitted for brevity -->
</chart:SfCartesianChart>
SfCartesianChart chart = new SfCartesianChart();
//code omitted for brevity
CategoryAxis primaryAxis = new CategoryAxis();
chart.XAxes.Add(primaryAxis);
NumericalAxis numericalAxis = new NumericalAxis();
NumericalPlotBandCollection numericalPlotBandCollection = new NumericalPlotBandCollection();
NumericalPlotBand plotBand1 = new NumericalPlotBand()
{
Start = 24,
End = 24,
Stroke = new SolidColorBrush(Color.FromArgb("#00E190")),
StrokeWidth = 2,
Fill = new SolidColorBrush(Color.FromArgb("#00E190")),
Text = "Low Temperature"
};
NumericalPlotBand plotBand2 = new NumericalPlotBand()
{
Start = 28,
End = 28,
Stroke = new SolidColorBrush(Color.FromArgb("#FCD404")),
StrokeWidth = 2,
Fill = new SolidColorBrush(Color.FromArgb("#FCD404")),
Text = "Average Temperature"
};
NumericalPlotBand plotBand3 = new NumericalPlotBand()
{
Start = 32,
End = 32,
Stroke = new SolidColorBrush(Color.FromArgb("#FF4E4E")),
StrokeWidth = 2,
Fill = new SolidColorBrush(Color.FromArgb("#FF4E4E")),
Text = "High Temperature"
};
numericalPlotBandCollection.Add(plotBand1);
numericalPlotBandCollection.Add(plotBand2);
numericalPlotBandCollection.Add(plotBand3);
numericalAxis.PlotBands = numericalPlotBandCollection;
chart.YAxes.Add(numericalAxis);
//code omitted for brevity
this.Content = chart;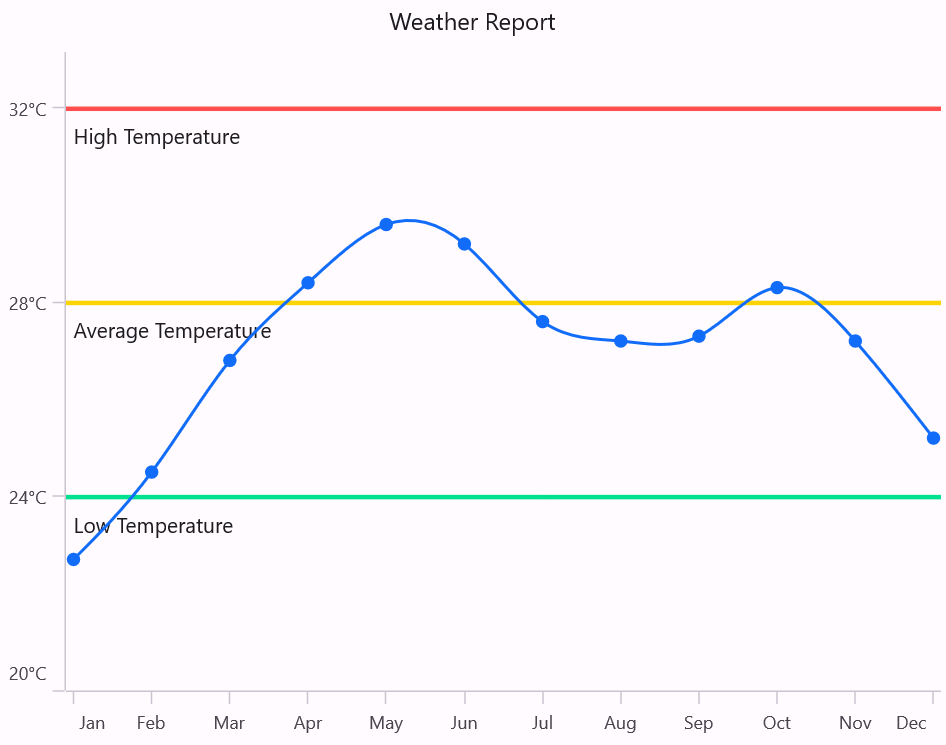
Text Customization
Text can be added to plot bands to indicate the significance of each particular region. The LabelStyle property provides options to customize plot band text.Following are the options available,
-
HorizontalTextAlignment- Gets or sets the horizontal alignment of text. -
VerticalTextAlignment- Gets or sets the vertical alignment of text. -
Angle- Gets or sets the angle for the text. -
OffsetX- Gets or sets the horizontal padding for the plot band text. -
OffsetY- Gets or sets the vertical padding for the plot band text.
<chart:SfCartesianChart>
    <!-- code omitted for brevity -->
    <chart:SfCartesianChart.XAxes>
       <chart:CategoryAxis/>
    </chart:SfCartesianChart.XAxes>

    <chart:SfCartesianChart.YAxes>
        <chart:NumericalAxis>
            <chart:NumericalAxis.PlotBands>
                <chart:NumericalPlotBandCollection>
                    <chart:NumericalPlotBand Start="28"
                                             Size="10"
                                             Fill="Orange"
                                             Text="Plot Band">
                        <chart:NumericalPlotBand.LabelStyle>
                            <chart:ChartPlotBandLabelStyle TextColor="Blue"
                                                           FontSize="12"
                                                           FontAttributes="Bold"/>
                        </chart:NumericalPlotBand.LabelStyle>
                    </chart:NumericalPlotBand>
                </chart:NumericalPlotBandCollection>
            </chart:NumericalAxis.PlotBands>
        </chart:NumericalAxis>
    </chart:SfCartesianChart.YAxes>
    <!-- code omitted for brevity -->
</chart:SfCartesianChart>
SfCartesianChart chart = new SfCartesianChart();
//code omitted for brevity
CategoryAxis primaryAxis = new CategoryAxis();
chart.XAxes.Add(primaryAxis);
NumericalAxis numericalAxis = new NumericalAxis();
NumericalPlotBandCollection numericalPlotBandCollection = new NumericalPlotBandCollection();
NumericalPlotBand plotBand = new NumericalPlotBand
{
Start = 28,
Width = 10,
Fill = Colors.Orange,
Text = "Plot Band"
};
ChartPlotBandLabelStyle labelStyle = new ChartPlotBandLabelStyle()
{
TextColor = Colors.Blue,
FontSize = 12,
FontAttributes = FontAttributes.Bold
};
plotBand.LabelStyle = labelStyle;
numericalPlotBandCollection.Add(plotBand);
numericalAxis.PlotBands= numericalPlotBandCollection;
chart.YAxes.Add(numericalAxis);
//code omitted for brevity
this.Content = chart;