Zooming and Panning in .NET MAUI Chart
1 Jan 202515 minutes to read
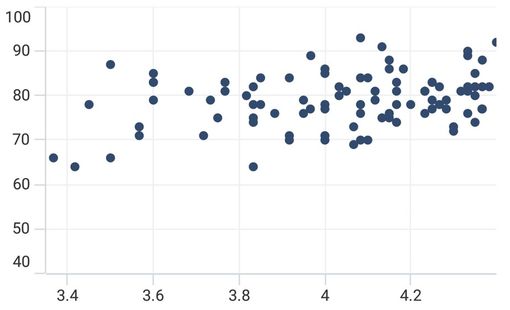
SfCartesianChart allows you to zoom the chart area with the help of the zoom feature. This behavior is mostly used to view the data point in the specific area, when there are large number of data points inside the chart.
Zooming and panning provides you to take a close-up look of the data point plotted in the series
Enable Zooming
To enable the zooming and panning in the chart, create an instance of ChartZoomPanBehavior and set it to the ZoomPanBehavior property of SfCartesianChart.
<chart:SfCartesianChart>
    ...
    <chart:SfCartesianChart.ZoomPanBehavior>
        <chart:ChartZoomPanBehavior/>
    </chart:SfCartesianChart.ZoomPanBehavior>
</chart:SfCartesianChart>
SfCartesianChart chart = new SfCartesianChart();
...
ChartZoomPanBehavior zooming = new ChartZoomPanBehavior();
chart.ZoomPanBehavior = zooming;
...
this.Content = chart;Zooming the Plot Area
Zooming the plot area can be achieved by pinch zooming, and also using the properties ZoomFactor and ZoomPosition.
Pinch Zooming
Pinch zooming is enable by using the EnablePinchZooming property to true as shown in the below code snippet.
<chart:SfCartesianChart>
    <chart:SfCartesianChart.ZoomPanBehavior>
        <chart:ChartZoomPanBehavior EnablePinchZooming="True"/>
    </chart:SfCartesianChart.ZoomPanBehavior>
    ...
</chart:SfCartesianChart>
SfCartesianChart chart = new SfCartesianChart();
...
ChartZoomPanBehavior zooming = new ChartZoomPanBehavior()
{
EnablePinchZooming = true
};
chart.ZoomPanBehavior = zooming;
...
this.Content = chart;Directional Zooming
The directional Zooming feature enhances your zooming experience by allowing you to zoom in and out in a specific direction. This feature is enabled by setting the EnableDirectionalZooming property to true as shown in the following code sample. The default value of this property is false.
<chart:SfCartesianChart>
    ...
    <chart:SfCartesianChart.ZoomPanBehavior>
        <chart:ChartZoomPanBehavior EnablePinchZooming="True"
                                    EnableDirectionalZooming="True"/>
    </chart:SfCartesianChart.ZoomPanBehavior>
    ...
</chart:SfCartesianChart>
SfCartesianChart chart = new SfCartesianChart();
...
ChartZoomPanBehavior zooming = new ChartZoomPanBehavior()
{
EnablePinchZooming = true,
EnableDirectionalZooming = true
};
chart.ZoomPanBehavior = zooming;
this.Content = chart;TIPS
EnablePinchZooming should be set as
true, because directional Zooming relies on the pinch gesture direction.
NOTE
The directional Zooming Feature is not supported in the macOS platform.
Zooming by setting ZoomFactor and ZoomPosition
ZoomFactor defines the percentage of visible range from the total range of axis values. ZoomPosition defines the position for ranges of values that need to be displayed as a result of ZoomFactor.
<chart:SfCartesianChart>
    <chart:SfCartesianChart.XAxes>
        <chart:CategoryAxis ZoomFactor="0.3"
                            ZoomPosition="0.5"/>
    </chart:SfCartesianChart.XAxes>
    ...
</chart:SfCartesianChart>
SfCartesianChart chart = new SfCartesianChart();
CategoryAxis primaryAxis = new CategoryAxis()
{
ZoomFactor = 0.3,
ZoomPosition = 0.5
};
chart.XAxes.Add(primaryAxis);
...
this.Content = chart;
Zooming Mode
The zooming can be done both horizontally and vertically. The zooming direction is defined by using the ZoomMode property.
Following code example illustrates how to restrict the chart to be zoomed only along horizontal axis.
<chart:SfCartesianChart>
    <chart:SfCartesianChart.ZoomPanBehavior>
        <chart:ChartZoomPanBehavior ZoomMode="X"/>
    </chart:SfCartesianChart.ZoomPanBehavior>
    ...
</chart:SfCartesianChart>
SfCartesianChart chart = new SfCartesianChart();
...
ChartZoomPanBehavior zooming = new ChartZoomPanBehavior()
{
ZoomMode = ZoomMode.X
};
chart.ZoomPanBehavior = zooming;
...
this.Content = chart;Following code example illustrates how to restrict the chart to be zoomed only along vertical axis.
<chart:SfCartesianChart>
    <chart:SfCartesianChart.ZoomPanBehavior>
        <chart:ChartZoomPanBehavior ZoomMode="Y"/>
    </chart:SfCartesianChart.ZoomPanBehavior>
    ...
</chart:SfCartesianChart>
SfCartesianChart chart = new SfCartesianChart();
ChartZoomPanBehavior zooming = new ChartZoomPanBehavior()
{
ZoomMode = ZoomMode.Y
};
chart.ZoomPanBehavior = zooming;
...
this.Content = chart;Maximum Zoom Level
The MaximumZoomLevel property is used to determine the maximum limit for zooming within the chart. Once the zooming operation reaches its limit, further zooming actions are not carried out. The MaximumZoomLevel property default value is double.NaN.
<chart:SfCartesianChart>
    <chart:SfCartesianChart.ZoomPanBehavior>
        <chart:ChartZoomPanBehavior MaximumZoomLevel="2"/>
    </chart:SfCartesianChart.ZoomPanBehavior>
    ...
</chart:SfCartesianChart>
SfCartesianChart chart = new SfCartesianChart();
...
ChartZoomPanBehavior zooming = new ChartZoomPanBehavior()
{
MaximumZoomLevel = 2
};
chart.ZoomPanBehavior = zooming;
...
this.Content = chart;Enable Panning
Panning feature allows moving the visible area of the chart when it is zoomed in. To enable panning, you have to set EnablePanning property to true.
<chart:SfCartesianChart>
    <chart:SfCartesianChart.ZoomPanBehavior>
        <chart:ChartZoomPanBehavior EnablePanning="True"/>
    </chart:SfCartesianChart.ZoomPanBehavior>
    ...
</chart:SfCartesianChart>
SfCartesianChart chart = new SfCartesianChart();
ChartZoomPanBehavior zooming = new ChartZoomPanBehavior()
{
EnablePanning = true
};
chart.ZoomPanBehavior = zooming;
...
this.Content = chart;Selection zooming
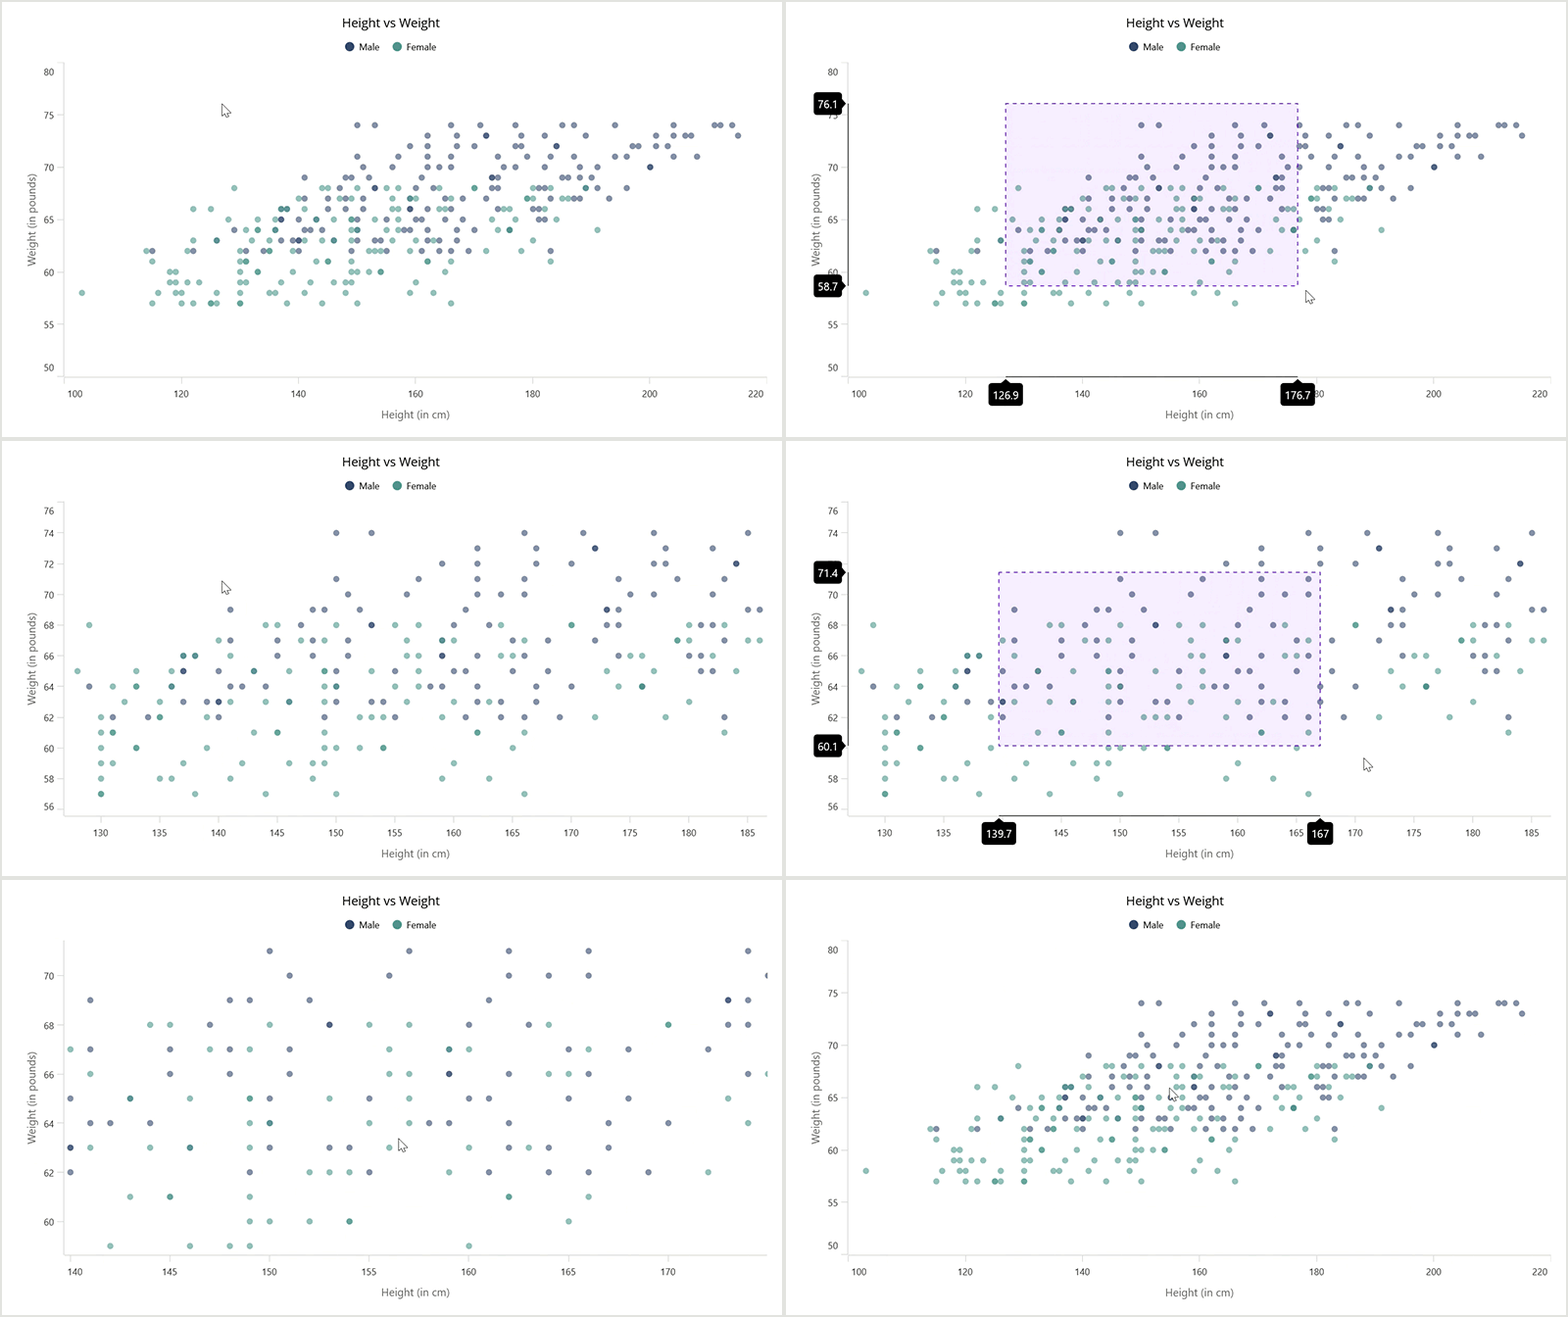
Selection zooming feature allows users to interactively choose a particular area of the chart and zoom in. By specifying the EnableSelectionZooming property to true as shown in the following code sample, you can double tap and drag to select a range on the chart to be zoomed in. The default value of this property is false.
NOTE
To perform selection zooming on a desktop, hold the left mouse button, double-click, and drag. For mobile, hold your finger, double-click, and drag to create a selection rectangle.
<chart:SfCartesianChart>
    <chart:SfCartesianChart.ZoomPanBehavior>
        <chart:ChartZoomPanBehavior EnableSelectionZooming ="True"/>
    </chart:SfCartesianChart.ZoomPanBehavior>
    ...
</chart:SfCartesianChart>
SfCartesianChart chart = new SfCartesianChart();
ChartZoomPanBehavior zooming = new ChartZoomPanBehavior()
{
EnableSelectionZooming = true
};
chart.ZoomPanBehavior = zooming;
...
Selection rectangle customization
You can customize the selection rectangle using the following properties:
-
SelectionRectStrokeWidth – Get or set the stroke width for selection rectangle.
-
SelectionRectStroke - Get or set the stroke color for selection rectangle.
-
SelectionRectStrokeDashArray - Get or set the stroke dashes for selection rectangle.
-
SelectionRectFill - Get or set the fill color for the selection rectangle.
Show trackball axis label
The selection zooming trackball axis label is enabled by setting the ShowTrackballLabel property to true. The default value of the ShowTrackballLabel is false. The TrackballLabelStyle property provides to customize the trackball axis labels. These options are:
-
Background, of type
Brush, describes the background color of the labels. -
CornerRadius, of type
CornerRadius, describes the corner radius of the label’s border. -
FontAttributes, of type
FontAttributes, determines text style. -
FontFamily, of type
string, defines the font family of the label. -
FontSize, of type
double, defines the font size of the labels. -
Margin, of type
Thickness, used to change the margin of the labels. -
Stroke, of type
Brush, describes the border stroke color of the labels. -
StrokeWidth, of type
double, defines the border thickness of the label. -
TextColor of type
Color, describes the color of the label’s text. -
LabelFormat of type
string, defines the label format. This property is used to set numeric or date-time format to the chart axis label.
NOTE
If the axis labels in the selection zooming trackball are cropped or hidden, you should use the LabelExtent property to extend the space between the axis labels and the axis title accordingly.
The following code sample illustrates how enable to axis trackball label while selection zooming.
<chart:SfCartesianChart>
    . . .
    <chart:SfCartesianChart.XAxes>
        <chart:NumericalAxis ShowTrackballLabel="True">
            <chart:NumericalAxis.TrackballLabelStyle>
                <chart:ChartLabelStyle Background="LightBlue"
                                       FontSize="15"
                                       CornerRadius="5"
                                       StrokeWidth="2"
                                       Stroke="Gray"/>
            </chart:NumericalAxis.TrackballLabelStyle>
        </chart:NumericalAxis>
    </chart:SfCartesianChart.XAxes>
    <chart:SfCartesianChart.YAxes>
        <chart:NumericalAxis ShowTrackballLabel="True">
            <chart:NumericalAxis.TrackballLabelStyle>
                <chart:ChartLabelStyle Background="LightBlue"
                                       FontSize="15"
                                       CornerRadius="5"
                                       StrokeWidth="2"
                                       Stroke="Gray"/>
            </chart:NumericalAxis.TrackballLabelStyle>
        </chart:NumericalAxis>
    </chart:SfCartesianChart.YAxes>
     . . .
</chart:SfCartesianChart>
SfCartesianChart chart = new SfCartesianChart();
. . .
NumericalAxis primaryAxis = new NumericalAxis();
primaryAxis.ShowTrackballLabel = true;
ChartLabelStyle primaryAxisTrackballLabelStyle = new ChartLabelStyle()
{
Background = Colors.LightBlue,
FontSize = 15,
CornerRadius = 5,
StrokeWidth = 2,
Stroke = Colors.Gray
};
primaryAxis.TrackballLabelStyle = primaryAxisTrackballLabelStyle;
chart.XAxes.Add(primaryAxis);
NumericalAxis secondaryAxis = new NumericalAxis();
secondaryAxis.ShowTrackballLabel = true;
ChartLabelStyle secondaryAxisTrackballLabelStyle = new ChartLabelStyle()
{
Background = Colors.LightBlue,
FontSize = 15,
CornerRadius = 5,
StrokeWidth = 2,
Stroke = Colors.Gray
};
secondaryAxis.TrackballLabelStyle = secondaryAxisTrackballLabelStyle;
chart.YAxes.Add(secondaryAxis);
. . .
this.Content = chart;Events
ZoomStart
The ZoomStart event is triggered when the user initiates a zoom action by using a pinch gesture on the chart. This event can be canceled, allowing its action to be interrupted or stopped.
- Axis - The ZoomStart event will be triggered for all the axes within the chart.
- CurrentZoomFactor - Used to get the updated zoom factor of the corresponding axis.
- CurrentZoomPosition - Used to get the updated zoom position of the corresponding axis.
- Cancel - Used to determine the value indicating whether the zooming process should be cancelled.
ZoomDelta
The ZoomDelta event is activated during the zooming process, and it is a cancelable event.
- Axis - The ZoomDelta event will be triggered for all the axes within the chart.
- PreviousZoomFactor - Used to get the previous zoom factor of the axis.
- PreviousZoomPosition - Used to get the previous zoom position of the axis.
- CurrentZoomFactor - Used to get the current zoom factor of the axis.
- CurrentZoomPosition - Used to get the current zoom position of the axis.
- Cancel - Used to determine the value indicating whether the zooming process should be cancelled.
ZoomEnd
The ZoomEnd event is triggered once the zooming action finishes.
- Axis - The ZoomEnd event will be triggered for all the axes within the chart.
- CurrentZoomFactor - Used to get the zoom factor after zooming process.
- CurrentZoomPosition - Used to get the zoom position after zooming process.
SelectionZoomStart
The SelectionZoomStart event is triggered when the user begins box selection zooming.
- ZoomRect - Used to get the initial bounds of the box selection.
SelectionZoomDelta
The SelectionZoomDelta event is activated during the process of selecting a region for zooming, and it is a cancelable event.
- ZoomRect - Contains the bounds of the currently selected region.
- Cancel - Used to set the value indicating whether the box selection zooming process should be cancelled.
SelectionZoomEnd
The SelectionZoomEnd event is triggered after the selection zooming ends.
- ZoomRect - Used to obtain the final bounds of the zoomed region.
Scroll
The Scroll event is triggered during panning, and it is a cancelable event.
- Axis - The event will be triggered for all the axes within the chart.
- ZoomPosition - Gets the current zoom position of the axis.
- Cancel - Used to indicate whether the scrolling should be cancelled.
ResetZoom
The ResetZoom event is triggered after the chart is reset by double-tapping.
- Axis - The event will be triggered for all the axes within the chart.
- PreviousZoomFactor - Used to get the previous zoom factor of the axis.
- PreviousZoomPosition - Used to get the previous zoom position of the axis.