Annotations in .NET MAUI Cartesian Chart
10 Jul 202620 minutes to read
SfCartesianChart provides annotation support that allows you to mark specific areas of interest in the chart area. This feature enables you to add text, images, and custom views using the following annotations.
- Text annotation
- Shape annotation
- View annotation
NOTE
Prerequisite: Ensure that the required NuGet package is installed, the necessary namespaces are imported, and the SfCartesianChart control is properly configured in your application. For detailed setup and configuration instructions, refer to the Getting Started guide.
To learn how to add and customize annotations in .NET MAUI Cartesian Charts quickly, you can check the below video.
Adding Annotations
To add annotations, create an instance of any type of annotation and add it to the Annotations collection. For example, the EllipseAnnotation can be added.
<chart:SfCartesianChart>
    <!-- code omitted for brevity -->
    <chart:SfCartesianChart.Annotations>
        <chart:EllipseAnnotation X1="2" X2="4" Y1="10" Y2="15" Text="Ellipse"/>
    </chart:SfCartesianChart.Annotations>
</chart:SfCartesianChart>
SfCartesianChart chart = new SfCartesianChart();
//code omitted for brevity
var ellipse = new EllipseAnnotation()
{
X1 = 2,
Y1 = 10,
X2 = 4,
Y2 = 15,
Text = "Ellipse"
};
chart.Annotations.Add(ellipse);
this.Content = chart;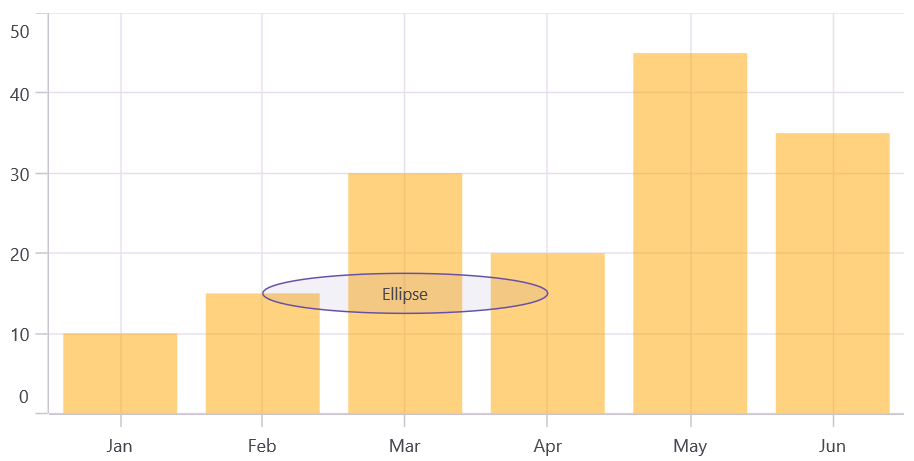
Positioning the annotation
Annotations can be positioned in the plot area based on the X1 and Y1 properties. For shape annotations, specify the X2 and Y2 properties, if needed. The X and Y values can be specified using axis units or pixel units, which can be identified by the CoordinateUnit property, as shown in the following code snippet:
<chart:SfCartesianChart>
    <!-- code omitted for brevity -->
    <chart:SfCartesianChart.Annotations>
        <chart:RectangleAnnotation X1="0" Y1="100" X2="300" Y2="400" Text="Pixel value" CoordinateUnit="Pixel"/>
    </chart:SfCartesianChart.Annotations>
</chart:SfCartesianChart>
SfCartesianChart chart = new SfCartesianChart();
//code omitted for brevity
var rectangle = new RectangleAnnotation()
{
X1 = 0,
Y1 = 100,
X2 = 300,
Y2 = 400,
CoordinateUnit = ChartCoordinateUnit.Pixel,
Text = "Pixel value"
};
chart.Annotations.Add(rectangle);
this.Content = chart;![]()
Adding annotation for multiple axes
When there are multiple axes, annotations can be added to a particular axis using the XAxisName and YAxisName properties. This is demonstrated in the code snippet below:
<chart:SfCartesianChart>
    <!-- code omitted for brevity -->
    <chart:SfCartesianChart.YAxes>
        <chart:NumericalAxis Minimum="0" Maximum="1"/>
        <chart:NumericalAxis Name="YAxis" CrossesAt="{Static x:Double.MaxValue}"/>
    </chart:SfCartesianChart.YAxes>

    <chart:SfCartesianChart.Annotations>
        <chart:EllipseAnnotation X1="2" X2="4" Y1="10" Y2="15" Text="Ellipse" YAxisName="YAxis"/>
    </chart:SfCartesianChart.Annotations>
</chart:SfCartesianChart>
SfCartesianChart chart = new SfCartesianChart();
//code omitted for brevity
NumericalAxis yAxis1 = new NumericalAxis();
yAxis1.Minimum = 0;
yAxis1.Maximum = 1;
chart.YAxes.Add(yAxis1);
NumericalAxis yAxis2 = new NumericalAxis();
yAxis2.Name = "YAxis";
yAxis2.CrossesAt = double.MaxValue;
chart.YAxes.Add(yAxis2);
var ellipse = new EllipseAnnotation()
{
X1 = 2,
Y1 = 10,
X2 = 4,
Y2 = 15,
Text = "Ellipse",
YAxisName = "YAxis"
};
chart.Annotations.Add(ellipse);
this.Content = chart;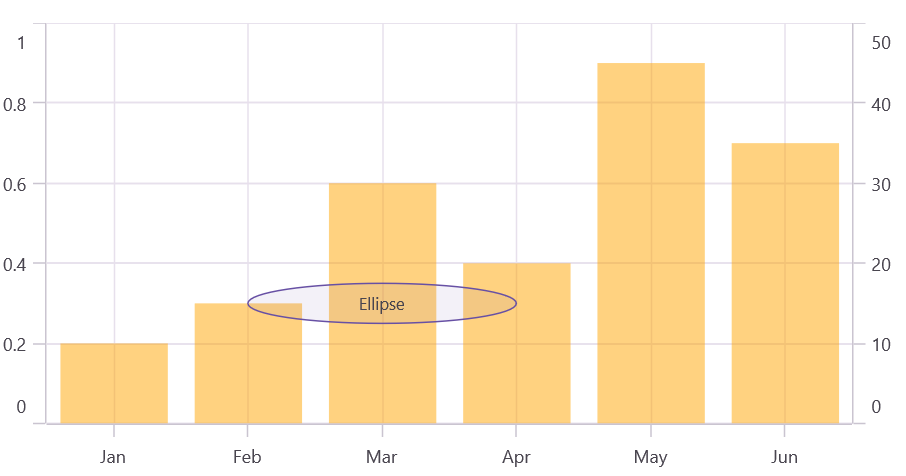
Text annotation
The TextAnnotation is used to add simple text at specific points in the chart area using the Text property.
<chart:SfCartesianChart>
    <!-- code omitted for brevity -->
    <chart:SfCartesianChart.Annotations>
        <chart:TextAnnotation X1="2" Y1="25" Text="Text Annotation"/>
    </chart:SfCartesianChart.Annotations>
</chart:SfCartesianChart>
SfCartesianChart chart = new SfCartesianChart();
//code omitted for brevity
var text = new TextAnnotation()
{
X1 = 2,
Y1 = 25,
Text = "Text Annotation"
};
chart.Annotations.Add(text);
this.Content = chart;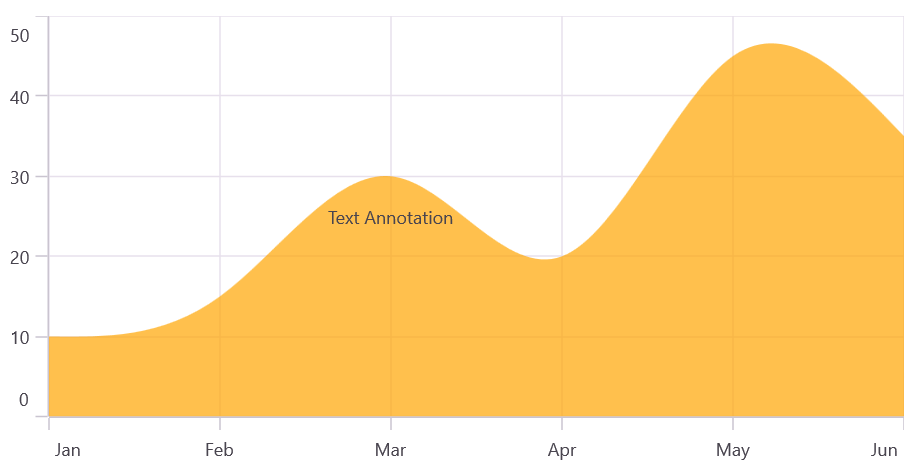
Text Customization
The TextAnnotation can be customized using the LabelStyle property. The LabelStyle property provides options to customize the font-family, font-size, font-attributes, and text color of axis labels. The following properties are used to customize the text:
- TextColor - Gets or sets the text color of the label.
- Background - Gets or sets the background color of the labels.
- Margin - Gets or sets the margin of the label to customize the appearance of label.
- FontFamily - Gets or sets the font family name for the label.
- FontAttributes - Gets or sets the font style for the label.
- FontSize - Gets or sets the font size for the label.
- HorizontalTextAlignment - Gets or sets the horizontal alignment of the label.
- VerticalTextAlignment - Gets or sets the vertical alignment of the label.
Shape annotation
The ShapeAnnotation allows you to add annotations in the form of shapes such as rectangles, ellipses, lines, horizontal lines, and vertical lines at specific areas of interest in the chart area.
- RectangleAnnotation - Used to draw a rectangle over the chart area.
- EllipseAnnotation - Used to draw a circle or an ellipse over the chart area.
- LineAnnotation - Used to draw a line over the chart area.
- VerticalLineAnnotation - Used to draw a vertical line across the chart area.
- HorizontalLineAnnotation - Used to draw a horizontal line across the chart area.
The following APIs are commonly used in all ShapeAnnotation:
- X2 - Gets or sets the X2 coordinate of the shape annotation.
- Y2 - Gets or sets the Y2 coordinate of the shape annotation.
- Fill - Gets or sets the background color of the shape annotation.
- Stroke - Gets or sets the stroke color of the shape annotation.
- StrokeWidth - Gets or sets the stroke width of the shape annotation.
- StrokeDashArray - Gets or sets the stroke dash pattern of the shape annotation.
- Text - Gets or sets the annotation text of the shape annotation.
- LabelStyle - Gets or sets the style for customizing the annotation text of the shape annotation.
Rectangle annotation
The RectangleAnnotation is used to draw a rectangle or a square at specific points in the chart area.
<chart:SfCartesianChart>
    <!-- code omitted for brevity -->
    <chart:SfCartesianChart.Annotations>
        <chart:RectangleAnnotation X1="1" Y1="40" X2="2" Y2="20"/>
    </chart:SfCartesianChart.Annotations>
</chart:SfCartesianChart>
SfCartesianChart chart = new SfCartesianChart();
//code omitted for brevity
var rectangle = new RectangleAnnotation()
{
X1 = 1,
Y1 = 40,
X2 = 2,
Y2 = 20,
};
chart.Annotations.Add(rectangle);
this.Content = chart;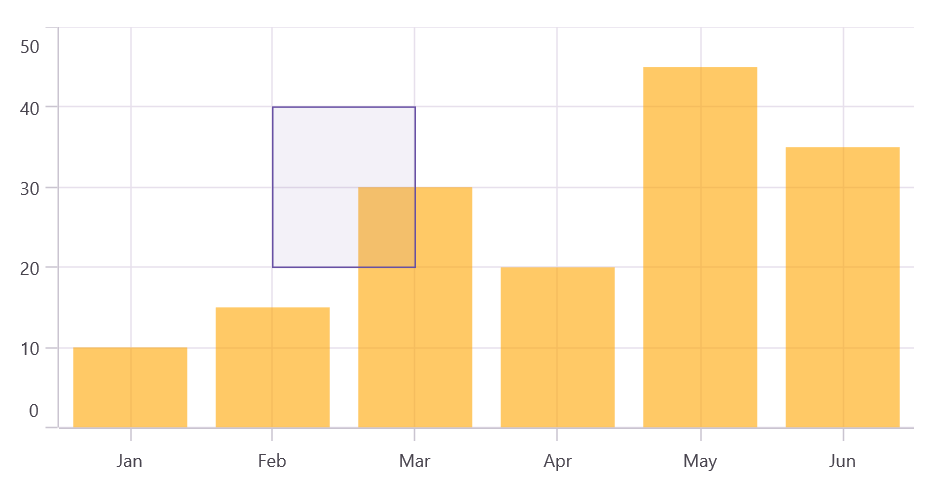
Ellipse annotation
The EllipseAnnotation is used to draw an oval or a circle at specific points in the chart area. You can also specify the height and width of the EllipseAnnotation by using the Height and Width properties, respectively.
<chart:SfCartesianChart>
    <!-- code omitted for brevity -->
    <chart:SfCartesianChart.Annotations>
        <chart:EllipseAnnotation X1="2" X2="4" Y1="10" Y2="15" Width="20" Height="20"/>
    </chart:SfCartesianChart.Annotations>
</chart:SfCartesianChart>
SfCartesianChart chart = new SfCartesianChart();
//code omitted for brevity
var ellipse = new EllipseAnnotation()
{
X1 = 2,
Y1 = 10,
X2 = 4,
Y2 = 15,
Width = 20,
Height = 20
};
chart.Annotations.Add(ellipse);
this.Content = chart;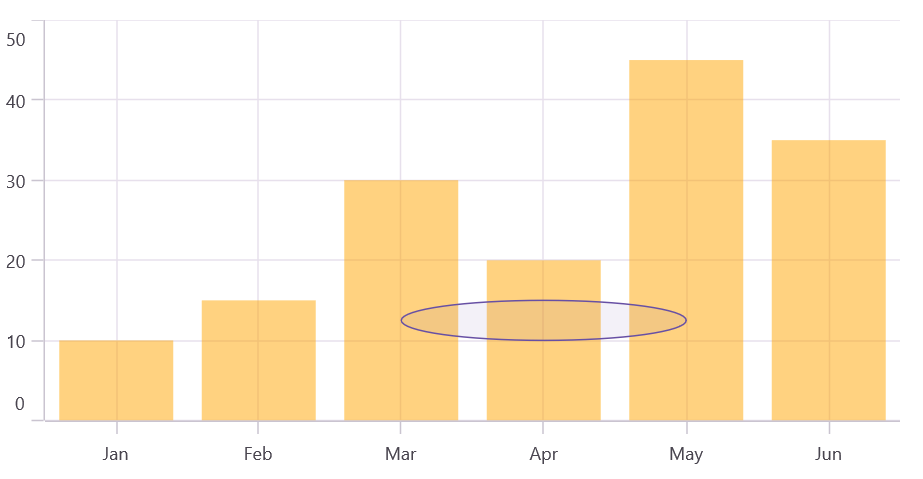
NOTE
When the X2 and Y2 properties of the EllipseAnnotation are set, the Height and Width properties become ineffective.
Line annotation
The LineAnnotation is used to draw a line at specific points in the chart area.
<chart:SfCartesianChart>
    <!-- code omitted for brevity -->
    <chart:SfCartesianChart.Annotations>
        <chart:LineAnnotation X1="0.5" Y1="10" X2="3.5" Y2="20" Text="Line"/>
    </chart:SfCartesianChart.Annotations>
</chart:SfCartesianChart>
SfCartesianChart chart = new SfCartesianChart();
//code omitted for brevity
var line = new LineAnnotation()
{
X1 = 0.5,
Y1 = 10,
X2 = 3.5,
Y2 = 20,
Text = "Line"
};
chart.Annotations.Add(line);
this.Content = chart;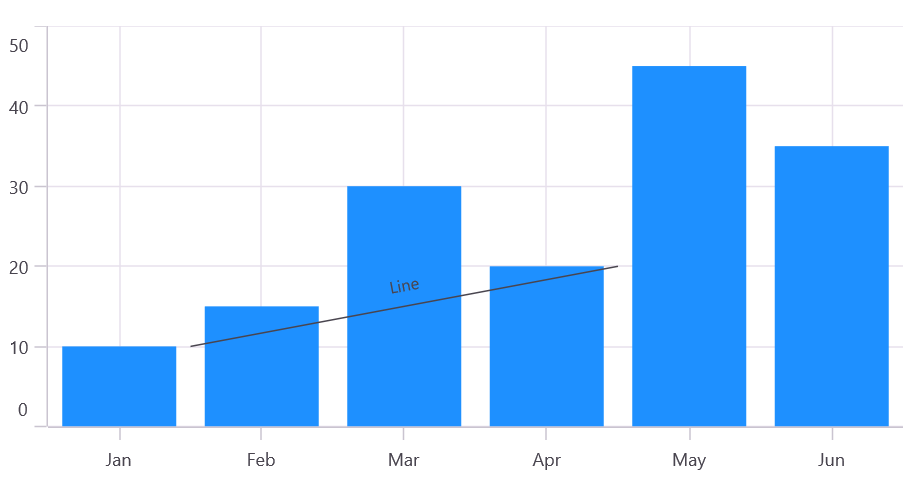
Vertical and Horizontal line annotations
The VerticalLineAnnotation and HorizontalLineAnnotation are used to draw vertical and horizontal lines at specific points in the chart area.
<chart:SfCartesianChart>
    <!-- code omitted for brevity -->
    <chart:SfCartesianChart.Annotations>
        <chart:VerticalLineAnnotation X1="2"/>
        <chart:HorizontalLineAnnotation Y1="20"/>
    </chart:SfCartesianChart.Annotations>
</chart:SfCartesianChart>
SfCartesianChart chart = new SfCartesianChart();
//code omitted for brevity
var verticalLineAnnotation = new VerticalLineAnnotation()
{
X1 = 2,
};
var horizontalLineAnnotation = new HorizontalLineAnnotation()
{
Y1 = 20,
};
chart.Annotations.Add(verticalLineAnnotation);
chart.Annotations.Add(horizontalLineAnnotation);
this.Content = chart;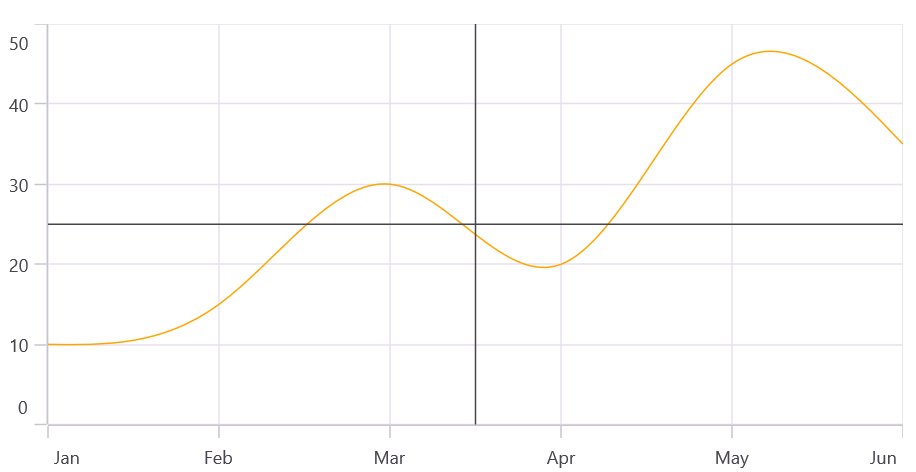
Displaying axis label for vertical and horizontal line annotations
The VerticalLineAnnotation and HorizontalLineAnnotation allow for the display of axis labels at the line’s position using the ShowAxisLabel property. The default value of the ShowAxisLabel property is ‘false’ as shown in the code snippet below:
<chart:SfCartesianChart>
    <!-- code omitted for brevity -->
    <chart:SfCartesianChart.Annotations>
        <chart:VerticalLineAnnotation X1="2.5" ShowAxisLabel="True"/>
        <chart:HorizontalLineAnnotation Y1="25" ShowAxisLabel="True"/>
    </chart:SfCartesianChart.Annotations>
</chart:SfCartesianChart>
SfCartesianChart chart = new SfCartesianChart();
//code omitted for brevity
var verticalLineAnnotation = new VerticalLineAnnotation()
{
X1 = 2.5,
ShowAxisLabel = true
};
var horizontalLineAnnotation = new HorizontalLineAnnotation()
{
Y1 = 25,
ShowAxisLabel = true
};
chart.Annotations.Add(verticalLineAnnotation);
chart.Annotations.Add(horizontalLineAnnotation);
this.Content = chart;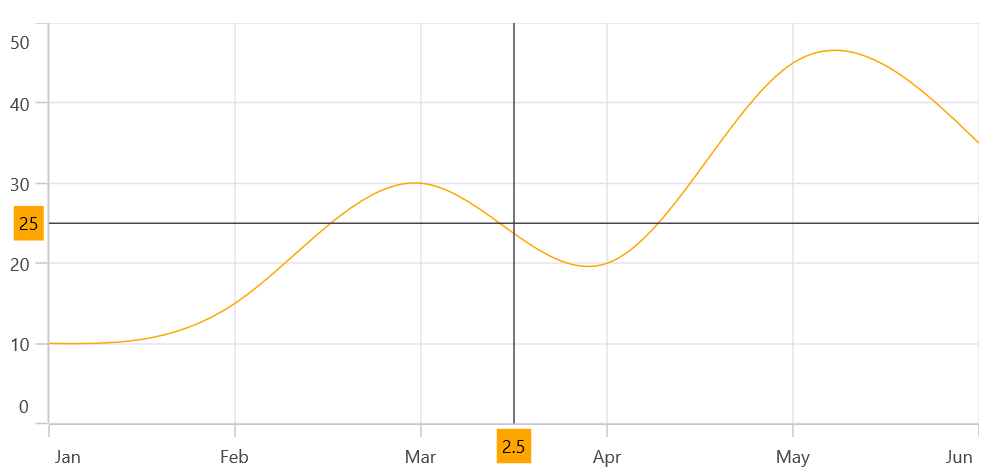
Axis label customization
The default appearance of the axis label can also be customized using the AxisLabelStyle property. The AxisLabelStyle property allows you to customize the axis labels by changing the font family, font size, font attributes, and text color. The following styles are used to customize the axis label:
- TextColor - Gets or sets the text color of the label.
- Background - Gets or sets the background color of the labels.
- Margin - Gets or sets the margin of the label to customize the appearance of label.
- FontFamily - Gets or sets the font family name for the label.
- FontAttributes - Gets or sets the font style for the label.
- FontSize - Gets or sets the font size for the label.
Adding arrow to vertical and horizontal line annotations
To display a single-headed arrow, set the LineCap property to Arrow. The default value of the LineCap property is None.
<chart:SfCartesianChart>
    <!-- code omitted for brevity -->
    <chart:SfCartesianChart.Annotations>
        <chart:VerticalLineAnnotation X1="2.5" LineCap="Arrow"/>
        <chart:HorizontalLineAnnotation Y1="25" LineCap="Arrow"/>
    </chart:SfCartesianChart.Annotations>
</chart:SfCartesianChart>
SfCartesianChart chart = new SfCartesianChart();
//code omitted for brevity
var verticalLineAnnotation = new VerticalLineAnnotation()
{
X1 = 2.5,
LineCap = ChartLineCap.Arrow
};
var horizontalLineAnnotation = new HorizontalLineAnnotation()
{
Y1 = 25,
LineCap = ChartLineCap.Arrow
};
chart.Annotations.Add(verticalLineAnnotation);
chart.Annotations.Add(horizontalLineAnnotation);
this.Content = chart;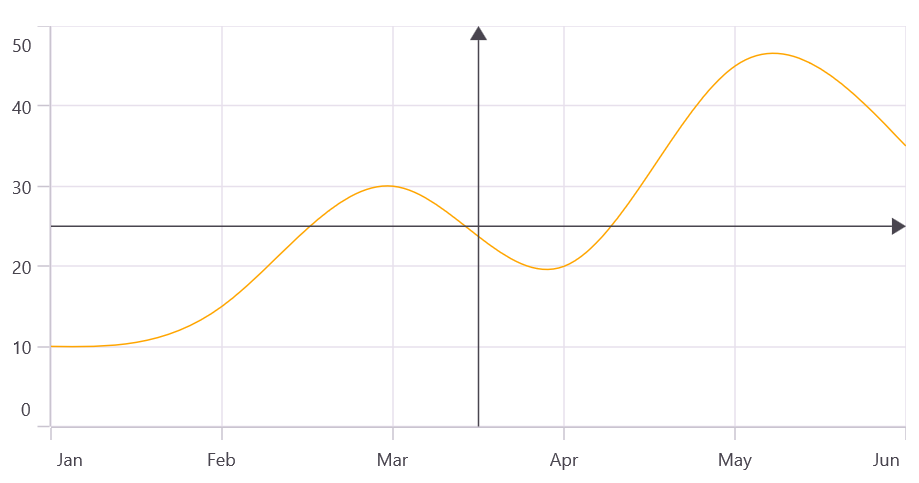
NOTE
The LineCap is applicable to line, horizontal, and vertical annotations.
Adding text in shape annotation
For all shape annotations, the text can be displayed using the Text property.
<chart:SfCartesianChart>
    <!-- code omitted for brevity -->
    <chart:SfCartesianChart.Annotations>
        <chart:EllipseAnnotation X1="2" X2="4" Y1="10" Y2="15" Text="Ellipse"/>
    </chart:SfCartesianChart.Annotations>
</chart:SfCartesianChart>
SfCartesianChart chart = new SfCartesianChart();
//code omitted for brevity
var ellipseAnnotation = new EllipseAnnotation()
{
X1 = 2,
Y1 = 10,
X2 = 4,
Y2 = 15,
Text = "Ellipse"
};
chart.Annotations.Add(ellipseAnnotation);
this.Content = chart;
Text customization in shape annotation
The Text in shape annotation also can be customized by using the LabelStyle property. The LabelStyle property provides options to customize the font-family, font-size, font-attributes and text color of axis labels.
- TextColor - Gets or sets the text color of the label.
- Background - Gets or sets the background color of the labels.
- Margin - Gets or sets the margin of the label to customize the appearance of label.
- FontFamily - Gets or sets the font family name for the label.
- FontAttributes - Gets or sets the font style for the label.
- FontSize - Gets or sets the font size for the label.
- HorizontalTextAlignment - Gets or sets the horizontal alignment of the label.
- VerticalTextAlignment - Gets or sets the vertical alignment of the label.
View annotation
The ViewAnnotation allows you to add annotations in the form of your own custom view using the View property at a specific area of interest in the chart area. Additionally, the ViewAnnotation can be aligned using the VerticalAlignment and HorizontalAlignment properties.
<chart:SfCartesianChart>
    <!-- code omitted for brevity -->
    <chart:SfCartesianChart.Annotations>
        <chart:ViewAnnotation X1="3" Y1="30">
            <chart:ViewAnnotation.View>
                <Image Source="cloud.png"/>
            </chart:ViewAnnotation.View>
        </chart:ViewAnnotation>
    </chart:SfCartesianChart.Annotations>
</chart:SfCartesianChart>
SfCartesianChart chart = new SfCartesianChart();
//code omitted for brevity
var viewAnnotation = new ViewAnnotation()
{
X1 = 3,
Y1 = 30,
View = new Image() { Source = "cloud.png" }
};
chart.Annotations.Add(viewAnnotation);
this.Content = chart;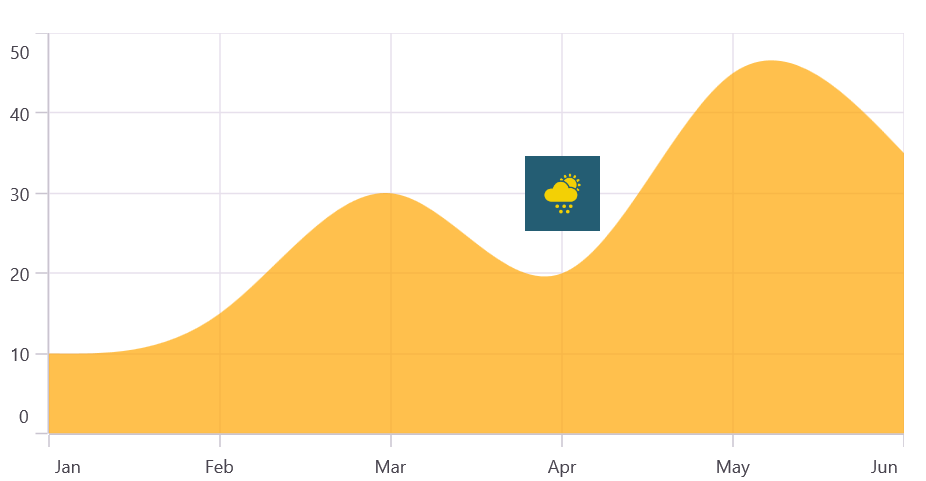
Annotation Visibility
The IsVisible property of ChartAnnotation is used to toggle the visibility of the annotation.
<chart:SfCartesianChart>
    <!-- code omitted for brevity -->
    <chart:SfCartesianChart.Annotations>
        <chart:EllipseAnnotation X1="2" X2="4" Y1="10" Y2="15" Text="Ellipse" IsVisible="False"/>
    </chart:SfCartesianChart.Annotations>
</chart:SfCartesianChart>
SfCartesianChart chart = new SfCartesianChart();
...
var ellipseAnnotation = new EllipseAnnotation()
{
X1 = 2,
Y1 = 10,
X2 = 4,
Y2 = 15,
Text = "Ellipse",
IsVisible = false
};
chart.Annotations.Add(ellipse);
this.Content = chart;Event
AnnotationTapped
The AnnotationTapped event occurs when an annotation is tapped. The AnnotationTappedEventArgs provides the following details:
- Annotation – the annotation instance that was tapped.
- X – the X coordinate of the touch or mouse click position.
- Y – the Y coordinate of the touch or mouse click position.
Public methods
The following override methods allow you to handle touch interactions on annotations:
- OnTouchDown() – triggered when touch starts (down) on the annotation.
- OnTouchMove() – triggered when moving (dragging) the finger or mouse across the annotation.
- OnTouchUp() – triggered when touch ends (up) by lifting the finger or releasing the mouse from the annotation.
public class LineAnnotationExt : LineAnnotation
{
    protected override void OnTouchDown(float pointX, float pointY)
    {
       base.OnTouchDown(pointX, pointY);
    }

    protected override void OnTouchMove(float pointX, float pointY)
    {
       base.OnTouchMove(pointX, pointY);
    }

    protected override void OnTouchUp(float pointX, float pointY)
    {
       base.OnTouchUp(pointX, pointY);
    }
}