Trackball in .NET MAUI Cartesian Chart
10 Jul 202623 minutes to read
The trackball allows you to show a tooltip for the nearest data points when you interact with the chart area. On mobile, long-press the chart to show the trackball, and drag the chart to change the trackball’s location constantly. To display the trackball on the desktop, move the cursor over the chart area.
NOTE
Prerequisite: Ensure that the required NuGet package is installed, the necessary namespaces are imported, and the SfCartesianChart control is properly configured in your application. For detailed setup and configuration instructions, refer to the Getting Started guide.
Enable trackball
To enable the trackball in the chart, create an instance of the ChartTrackballBehavior and set it to the TrackballBehavior property. The following properties are used to show or hide the line and tooltip.
-
ShowLabel, of type
bool, shows or hides the trackball label. The default value isTrue. -
ShowMarkers, of type
bool, shows or hides trackball markers. The default value isTrue. -
ShowLine, of type
bool, shows or hides the trackball line. The default value isTrue.
<chart:SfCartesianChart>
    <!-- code omitted for brevity -->
    <chart:SfCartesianChart.TrackballBehavior>
        <chart:ChartTrackballBehavior/>
    </chart:SfCartesianChart.TrackballBehavior>
    <!-- code omitted for brevity -->
</chart:SfCartesianChart>
SfCartesianChart chart = new SfCartesianChart();
// code omitted for brevity
ChartTrackballBehavior trackball = new ChartTrackballBehavior();
chart.TrackballBehavior = trackball;
// code omitted for brevity
this.Content = chart;Enable label display mode
The DisplayMode property specifies whether a label should be displayed for all data points along the trackball line or only the nearest data point label. The default value is FloatAllPoints. The following choices are available for this property.
-
FloatAllPoints– Displays labels for all the data points along the vertical line. -
NearestPoint– Displays a label for a single data point nearer to the touch point on the chart area. -
GroupAllPoints– Displays all the data point labels grouped at the top of the chart area.
<chart:SfCartesianChart>
    <!-- code omitted for brevity -->
    <chart:SfCartesianChart.TrackballBehavior>
        <chart:ChartTrackballBehavior ShowLine="True"
                                      DisplayMode="NearestPoint"/>
    </chart:SfCartesianChart.TrackballBehavior>
    <!-- code omitted for brevity -->
</chart:SfCartesianChart>
SfCartesianChart chart = new SfCartesianChart();
// code omitted for brevity
ChartTrackballBehavior trackball = new ChartTrackballBehavior()
{
ShowLine = true,
DisplayMode = LabelDisplayMode.NearestPoint
};
chart.TrackballBehavior = trackball;
// code omitted for brevity
this.Content = chart;Activation mode
The ActivationMode property is used to restrict the visibility of the trackball based on the touch actions.
The ChartTrackballActivationMode enum contains the following values:
-
LongPress– Activates the trackball only when performing the long-press action. -
TouchMove– Activates the trackball only when performing a touch-move action. -
None– Hides the trackball when the activation mode is set toNone. It will be activated when calling theShowmethod.
<chart:SfCartesianChart>
    <!-- code omitted for brevity -->
    <chart:SfCartesianChart.TrackballBehavior>
        <chart:ChartTrackballBehavior ActivationMode="LongPress"/>
    </chart:SfCartesianChart.TrackballBehavior>
    <!-- code omitted for brevity -->
</chart:SfCartesianChart>
SfCartesianChart chart = new SfCartesianChart();
// code omitted for brevity
ChartTrackballBehavior trackball = new ChartTrackballBehavior()
{
ActivationMode = ChartTrackballActivationMode.LongPress
};
chart.TrackballBehavior = trackball;
// code omitted for brevity
this.Content = chart;NOTE
The default value of the ActivationMode property is
ChartTrackballActivationMode.LongPressfor the Android and iOS platforms, and the default value for the macOS and Windows platforms isChartTrackballActivationMode.TouchMove.
NOTE
On Windows, LongPress gestures are supported only through touch input, not with a mouse. Consequently, when ActivationMode is set to LongPress, the trackball activates only via touch interaction, not with mouse interaction.
Appearance customization
Trackball label customization
The LabelStyle property is used to customize the trackball labels, of the ChartLabelStyle class. These options are:
-
Background, of type
Brush, is used to change the label background color. -
Margin, of type
Thickness, is used to change the margin of the label. -
TextColor, of type
Color, is used to change the text color. -
StrokeWidth, of type
double, is used to change the stroke thickness of the label. -
Stroke, of type
Brush, is used to customize the border of the label. -
LabelFormat, of type
string, is used to change the format of the label. -
FontFamily, of type
string, is used to change the font family for the trackball label. -
FontAttributes, of type
FontAttributes, is used to change the font style for the trackball label. -
FontSize, of type
double, is used to change the font size for the trackball label. -
CornerRadius, of type
CornerRadius, is used to set the rounded corners for labels.
<chart:SfCartesianChart>
    <!-- code omitted for brevity -->
    <chart:ChartTrackballBehavior.LabelStyle>
        <chart:ChartLabelStyle Background="LightBlue"
                               FontSize="15"
                               CornerRadius="5"
                               StrokeWidth="2"
                               Stroke="Gray"/>
    </chart:ChartTrackballBehavior.LabelStyle>
    <!-- code omitted for brevity -->
</chart:SfCartesianChart>
SfCartesianChart chart = new SfCartesianChart();
// code omitted for brevity
ChartTrackballBehavior trackball = new ChartTrackballBehavior();
ChartLabelStyle labelStyle = new ChartLabelStyle()
{
Background = new SolidColorBrush(Colors.LightBlue),
FontSize = 15,
CornerRadius = 5,
StrokeWidth = 2,
Stroke = new SolidColorBrush(Colors.Gray)
};
trackball.LabelStyle = labelStyle;
chart.TrackballBehavior = trackball;
// code omitted for brevity
this.Content = chart;Trackball line customization
The LineStyle property is used to customize the trackball line, of the ChartLineStyle class. These options are:
-
StrokeWidth, of type
double, is used to change the stroke width of the line. -
Stroke, of type
Brush, is used to change the stroke color of the line. -
StrokeDashArray, of type
DoubleCollection, specifies the dashes to be applied on the line.
<chart:SfCartesianChart>
    <!-- code omitted for brevity -->
    <chart:ChartTrackballBehavior.LineStyle>
        <chart:ChartLineStyle Stroke="Gray"
                              StrokeWidth="4"/>
    </chart:ChartTrackballBehavior.LineStyle>
    <!-- code omitted for brevity -->
</chart:SfCartesianChart>
SfCartesianChart chart = new SfCartesianChart();
// code omitted for brevity
ChartTrackballBehavior trackball = new ChartTrackballBehavior();
ChartLineStyle lineStyle = new ChartLineStyle()
{
Stroke = new SolidColorBrush(Colors.Gray),
StrokeWidth = 4
};
trackball.LineStyle = lineStyle;
chart.TrackballBehavior = trackball;
// code omitted for brevity
this.Content = chart;Trackball marker customization
The MarkerSettings property is used to customize the trackball markers, of the ChartMarkerSettings class. The trackball marker can be customized using the following properties.
-
Type, of type
ShapeType, is used to set the marker shape type. -
Stroke, of type
Brush, is used to change the marker border color. -
Fill, of type
Brush, is used to change the marker background color. -
StrokeWidth, of type
double, is used to change the width of the marker border. -
Width, of type
double, is used to change the width of the marker. -
Height, of type
double, is used to change the height of the marker.
<chart:SfCartesianChart>
    <!-- code omitted for brevity -->
    <chart:SfCartesianChart.TrackballBehavior>
        <chart:ChartTrackballBehavior>
            <chart:ChartTrackballBehavior.MarkerSettings>
                <chart:ChartMarkerSettings Height="10" Width="10" Fill="Red"/>
            </chart:ChartTrackballBehavior.MarkerSettings>
        </chart:ChartTrackballBehavior>
    </chart:SfCartesianChart.TrackballBehavior>
    <!-- code omitted for brevity -->
</chart:SfCartesianChart>
SfCartesianChart chart = new SfCartesianChart();
// code omitted for brevity
ChartTrackballBehavior trackball = new ChartTrackballBehavior();
ChartMarkerSettings markerSettings = new ChartMarkerSettings()
{
Height = 10,
Width = 10,
Fill = new SolidColorBrush(Colors.Red)
};
trackball.MarkerSettings = markerSettings;
chart.TrackballBehavior = trackball;
// code omitted for brevity
this.Content = chart;Series trackball label template
Trackball labels can be customized by adding any view as its template by using TrackballLabelTemplate of CartesianSeries.
TIPS
The
DataItemcan be used to access the data linked to the associated business model. The binding context forTrackballLabelTemplateisTrackballPointInfo, which provides the necessary data for the labels.
<chart:SfCartesianChart>
    <chart:SfCartesianChart.Resources>
        <DataTemplate x:Key="trackballLabelTemplate">
            <HorizontalStackLayout>
                <Image Source="image.png" WidthRequest="20" HeightRequest="20"/>
                <Label Text="{Binding Series.Label, StringFormat=' {0}'}" FontSize="12" HorizontalOptions="Center"  TextColor="White"/>
                <Label Text="{Binding DataItem.YValues,StringFormat=': {0}M'}" FontSize="12" HorizontalOptions="Center" TextColor="White"/>
            </HorizontalStackLayout>
        </DataTemplate>
    </chart:SfCartesianChart.Resources>

    <chart:SfCartesianChart.TrackballBehavior>
        <chart:ChartTrackballBehavior/>
    </chart:SfCartesianChart.TrackballBehavior>
    <!-- code omitted for brevity -->
    <chart:LineSeries ItemsSource="{Binding Data1}"
                      TrackballLabelTemplate="{StaticResource trackballLabelTemplate}"
                      XBindingPath="XValues"
                      YBindingPath="YValues"
                      Label="Thomas"/>

    <chart:LineSeries ItemsSource="{Binding Data2}"
                      TrackballLabelTemplate="{StaticResource trackballLabelTemplate}"
                      XBindingPath="XValues"
                      YBindingPath="YValues"
                      Label="Elizabeth"/>

    <chart:LineSeries ItemsSource="{Binding Data3}"
                      TrackballLabelTemplate="{StaticResource trackballLabelTemplate}"
                      XBindingPath="XValues"
                      YBindingPath="YValues"
                      Label="Andrew"/>
    <!-- code omitted for brevity -->
</chart:SfCartesianChart>
SfCartesianChart chart = new SfCartesianChart();
ChartTrackballBehavior trackball = new ChartTrackballBehavior();
chart.TrackballBehavior = trackball;
// code omitted for brevity
LineSeries series1 = new LineSeries();
series1.ItemsSource = new ViewModel().Data1;
series1.XBindingPath = "XValues";
series1.YBindingPath = "YValues";
series1.Label = "Thomas";
LineSeries series2 = new LineSeries();
series2.ItemsSource = new ViewModel().Data2;
series2.XBindingPath = "XValues";
series2.YBindingPath = "YValues";
series2.Label = "Elizabeth";
LineSeries series3 = new LineSeries();
series3.ItemsSource = new ViewModel().Data3;
series3.XBindingPath = "XValues";
series3.YBindingPath = "YValues";
series3.Label = "Andrew";
DataTemplate trackballLabelTemplate = new DataTemplate(() =>
{
HorizontalStackLayout horizontalStackLayout = new HorizontalStackLayout();
Image image = new Image()
{
Source = "image.png",
WidthRequest = 20,
HeightRequest = 20
};
Label label1 = new Label()
{
FontSize = 15,
HorizontalOptions = LayoutOptions.Center,
TextColor = Colors.White
};
label1.SetBinding(Label.TextProperty, new Binding("Series.Label", stringFormat: " {0}"));
Label label2 = new Label()
{
FontSize = 15,
HorizontalOptions = LayoutOptions.Center,
TextColor = Colors.White
};
label2.SetBinding(Label.TextProperty, new Binding("DataItem.YValues", stringFormat: ": {0}M"));
horizontalStackLayout.Add(image);
horizontalStackLayout.Add(label1);
horizontalStackLayout.Add(label2);
return horizontalStackLayout;
});
series1.TrackballLabelTemplate = trackballLabelTemplate;
series2.TrackballLabelTemplate = trackballLabelTemplate;
series3.TrackballLabelTemplate = trackballLabelTemplate;
chart.Series.Add(series1);
chart.Series.Add(series2);
chart.Series.Add(series3);
this.Content = chart;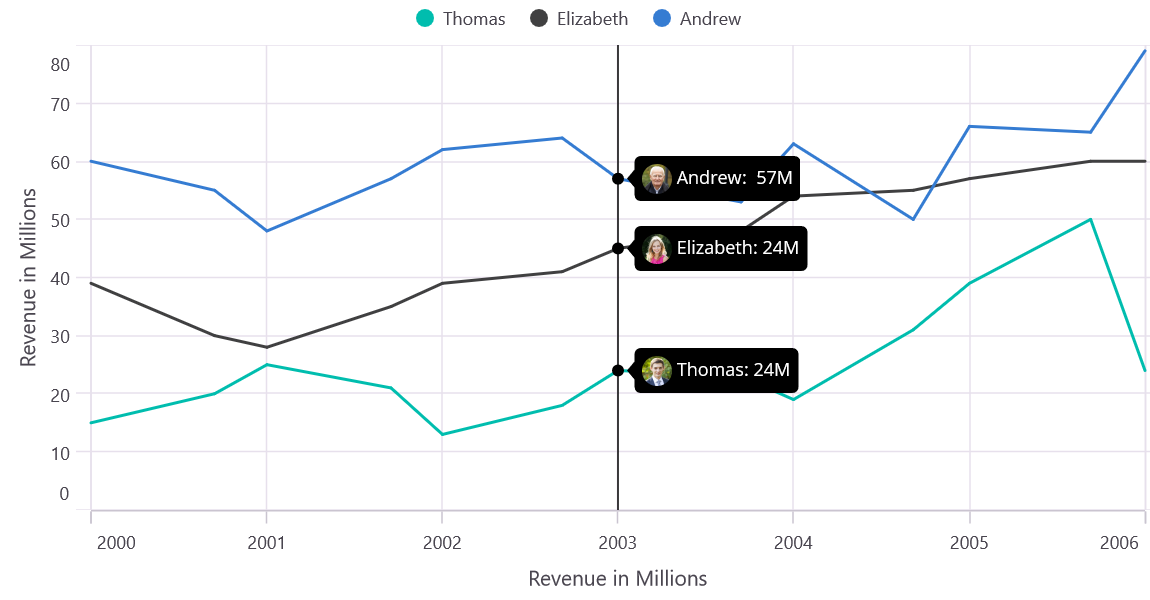
Axis trackball label template
To customize the appearance of axis labels on the trackball, you can use the TrackballLabelTemplate property of the ChartAxis.
<chart:SfCartesianChart>
    <chart:SfCartesianChart.Resources>
        <DataTemplate x:Key="axisLabelTemplate">
            <Label WidthRequest="50" HeightRequest="20" HorizontalTextAlignment="Center" Background="Blue" Text="{Binding Date}" TextColor="White" FontSize="15"/>
        </DataTemplate>
    </chart:SfCartesianChart.Resources>

    <chart:SfCartesianChart.TrackballBehavior>
        <chart:ChartTrackballBehavior/>
    </chart:SfCartesianChart.TrackballBehavior>

    <chart:SfCartesianChart.XAxes>
        <chart:DateTimeAxis TrackballLabelTemplate="{StaticResource axisLabelTemplate}" ShowTrackballLabel="True"/>
    </chart:SfCartesianChart.XAxes>

    <chart:SfCartesianChart.YAxes>
        <chart:NumericalAxis/>
    </chart:SfCartesianChart.YAxes>

    <chart:LineSeries ItemsSource="{Binding Data}"
                      XBindingPath="Date"
                      YBindingPath="Values"/>
</chart:SfCartesianChart>
SfCartesianChart chart = new SfCartesianChart();
ChartTrackballBehavior trackball = new ChartTrackballBehavior();
chart.TrackballBehavior = trackball;
DateTimeAxis primaryAxis = new DateTimeAxis();
primaryAxis.ShowTrackballLabel = true;
DataTemplate axisLabelTemplate = new DataTemplate(() =>
{
var label = new Label()
{
WidthRequest = 50,
HeightRequest = 20,
HorizontalTextAlignment = TextAlignment.Center,
Background = new SolidColorBrush(Colors.Blue),
TextColor = Colors.White,
FontSize = 15
};
label.SetBinding(Label.TextProperty, "Date");
return label;
});
primaryAxis.TrackballLabelTemplate = axisLabelTemplate;
chart.XAxes.Add(primaryAxis);
NumericalAxis secondaryAxis = new NumericalAxis();
chart.YAxes.Add(secondaryAxis);
LineSeries series = new LineSeries();
series.ItemsSource = new ViewModel().Data;
series.XBindingPath = "Date";
series.YBindingPath = "Values";
chart.Series.Add(series);
this.Content = chart;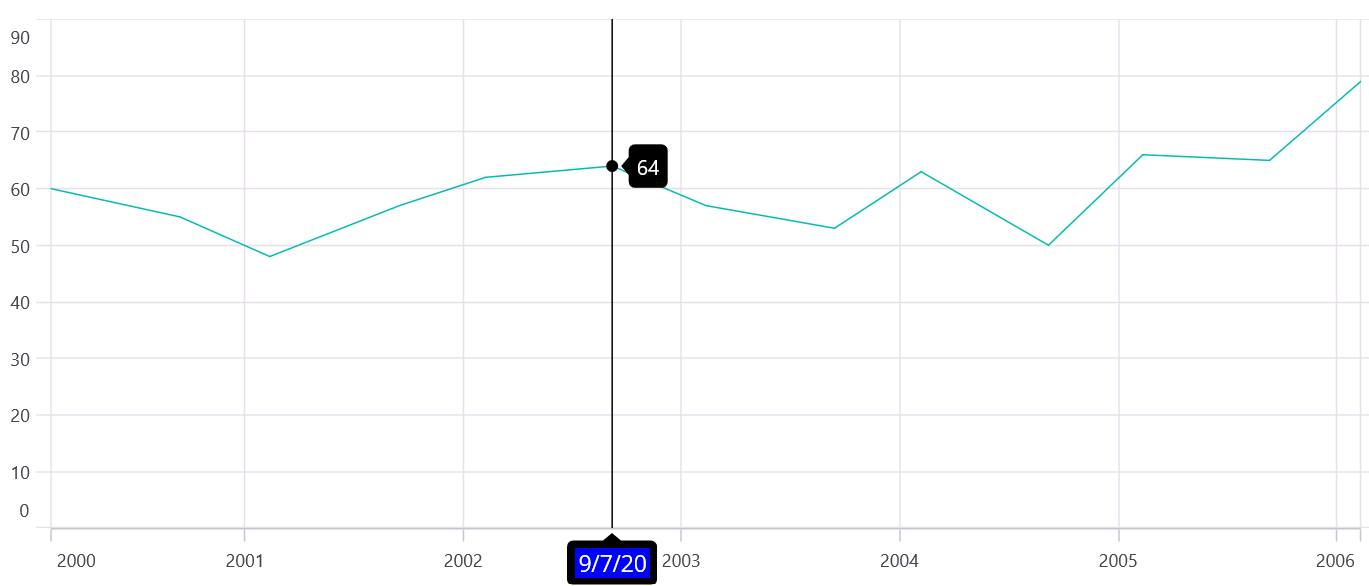
Show or hide the series label
The CartesianSeries.ShowTrackballLabel property is used to show or hide the series trackball label. The default value is True.
<chart:SfCartesianChart>
    <!-- code omitted for brevity -->
    <chart:LineSeries ShowTrackballLabel="False"
                      ItemsSource="{Binding Data}"
                      XBindingPath="Name"
                      YBindingPath="Run"/>
    <!-- code omitted for brevity -->
</chart:SfCartesianChart>
SfCartesianChart chart = new SfCartesianChart();
// code omitted for brevity
LineSeries lineSeries = new LineSeries()
{
ShowTrackballLabel = false,
ItemsSource = new ViewModel().Data,
XBindingPath = "Name",
YBindingPath = "Run"
};
chart.Series.Add(lineSeries);
// code omitted for brevity
this.Content = chart;Show or hide trackball label in axis
When the trackball moves across the axis, this feature highlights the related axis label. The ChartAxis.ShowTrackballLabel property is used to show or hide the axis’s trackball label. The ChartAxis.TrackballLabelStyle property is used to customize the appearance of the label. The default value of the ChartAxis.ShowTrackballLabel is False.
<chart:SfCartesianChart>
    <!-- code omitted for brevity -->
    <chart:CategoryAxis ShowTrackballLabel="True"/>
    <!-- code omitted for brevity -->
</chart:SfCartesianChart>
SfCartesianChart chart = new SfCartesianChart();
// code omitted for brevity
CategoryAxis chartAxis = new CategoryAxis();
chartAxis.ShowTrackballLabel = true;
chart.XAxes.Add(chartAxis);
// code omitted for brevity
this.Content = chart;Methods
-
Show(x, y)- The Show method is used to activate the trackball at the specified location. -
Hide()- The Hide method hides the trackball that is visible in the chart.
The following code sample illustrates how to call the Show and Hide methods.
SfCartesianChart chart = new SfCartesianChart();
// code omitted for brevity
ChartTrackballBehavior trackball = new ChartTrackballBehavior();
chart.TrackballBehavior = trackball;
// code omitted for brevity

// Activate the trackball at the specified location
trackball.Show(100, 200);

// Hide the trackball
trackball.Hide();

this.Content = chart;
Events
Trackball created
The TrackballCreated event occurs when the trackball moves from one data point to another. The event argument contains an object of the TrackballPointInfo class. The following properties are available in the TrackballPointInfo class to customize the appearance of the trackball label based on a condition:
-
Label, of type
string, is used to change the text of the trackball label. - LabelStyle, of type ChartLabelStyle, is used to customize the appearance of the trackball label.
- MarkerSettings, of type ChartMarkerSettings, is used to customize the trackball markers.
- Series, of type CartesianSeries, is used to get the series of the data point in which the trackball is activated.
-
DataItem, of type
object, is used to get the data associated with the specific point where the trackball is activated.
The following code sample illustrates how to subscribe to the TrackballCreated event.
SfCartesianChart chart = new SfCartesianChart();
// code omitted for brevity

chart.TrackballCreated += (sender, args) =>
{
    foreach (var pointInfo in args.TrackballPointInfos)
    {
        // Access the data associated with the trackball point
        var data = pointInfo.DataItem;
        // Customize the label text based on a condition
        pointInfo.Label = "Custom label";
    }
};

this.Content = chart;