Fast Line Chart in .NET MAUI Cartesian Chart
18 Nov 20185 minutes to read
Fast Line Chart
The FastLineSeries is a special kind of line series that can render a collection with a large number of data points. It is optimized for performance when compared to the regular LineSeries, making it suitable for large datasets. To render a fast line chart, create an instance of FastLineSeries and add it to the Series collection property of SfCartesianChart.
Prerequisite: Ensure that the required NuGet package is installed, the necessary namespaces are imported, and the SfCartesianChart control is properly configured in your application. For detailed setup and configuration instructions, refer to the Getting Started guide.
The Cartesian chart has Series as its default content.
<chart:SfCartesianChart>
    <chart:SfCartesianChart.XAxes>
        <chart:DateTimeAxis/>
    </chart:SfCartesianChart.XAxes>

    <chart:SfCartesianChart.YAxes>
        <chart:NumericalAxis/>
    </chart:SfCartesianChart.YAxes>

    <chart:FastLineSeries ItemsSource="{Binding Data}"
                          XBindingPath="XValue"
                          YBindingPath="YValue"/>
</chart:SfCartesianChart>
SfCartesianChart chart = new SfCartesianChart();
DateTimeAxis primaryAxis = new DateTimeAxis();
chart.XAxes.Add(primaryAxis);
NumericalAxis secondaryAxis = new NumericalAxis();
chart.YAxes.Add(secondaryAxis);
FastLineSeries series = new FastLineSeries()
{
ItemsSource = new ViewModel().Data,
XBindingPath = "XValue",
YBindingPath = "YValue",
};
chart.Series.Add(series);
this.Content = chart;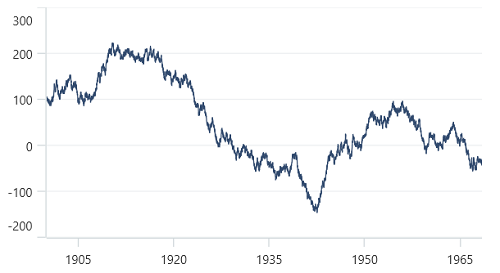
Dashed line
The StrokeDashArray property of FastLineSeries, of type DoubleCollection, is used to render the line with dashes. Values at odd indices define the dash length, while values at even indices define the gap.
<chart:SfCartesianChart>
    <chart:SfCartesianChart.Resources>
        <DoubleCollection x:Key="dashArray">
            <x:Double>5</x:Double>
            <x:Double>2</x:Double>
        </DoubleCollection>
    </chart:SfCartesianChart.Resources>

    <chart:SfCartesianChart.XAxes>
        <chart:DateTimeAxis/>
    </chart:SfCartesianChart.XAxes>

    <chart:SfCartesianChart.YAxes>
        <chart:NumericalAxis/>
    </chart:SfCartesianChart.YAxes>

    <chart:FastLineSeries ItemsSource="{Binding Data}"
                          XBindingPath="XValue"
                          YBindingPath="YValue"
                          StrokeDashArray="{StaticResource dashArray}"/>
</chart:SfCartesianChart>
SfCartesianChart chart = new SfCartesianChart();
DateTimeAxis primaryAxis = new DateTimeAxis();
chart.XAxes.Add(primaryAxis);
NumericalAxis secondaryAxis = new NumericalAxis();
chart.YAxes.Add(secondaryAxis);
DoubleCollection doubleCollection = new DoubleCollection();
doubleCollection.Add(5);
doubleCollection.Add(2);
FastLineSeries series = new FastLineSeries()
{
ItemsSource = new ViewModel().Data,
XBindingPath = "XValue",
YBindingPath = "YValue",
StrokeDashArray = doubleCollection
};
chart.Series.Add(series);
this.Content = chart;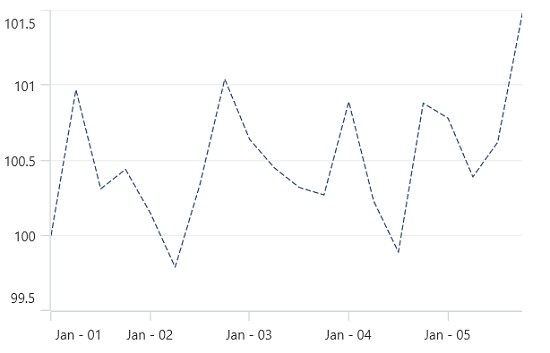
Anti-aliasing
There may be some jagged lines at the edges. This can be reduced by using the EnableAntiAliasing property. The default value is false. Enabling anti-aliasing improves visual quality but may impact performance with very large datasets.
<chart:SfCartesianChart>
    <!-- code omitted for brevity -->
    <chart:FastLineSeries ItemsSource="{Binding Data}"
                          XBindingPath="XValue"
                          YBindingPath="YValue"
                          EnableAntiAliasing="True"/>
</chart:SfCartesianChart>
SfCartesianChart chart = new SfCartesianChart();
// code omitted for brevity
FastLineSeries series = new FastLineSeries()
{
ItemsSource = new ViewModel().Data,
XBindingPath = "XValue",
YBindingPath = "YValue",
EnableAntiAliasing = true
};
chart.Series.Add(series);
this.Content = chart;