Bubble Chart in .NET MAUI Cartesian Chart
10 Jul 20264 minutes to read
Bubble Chart
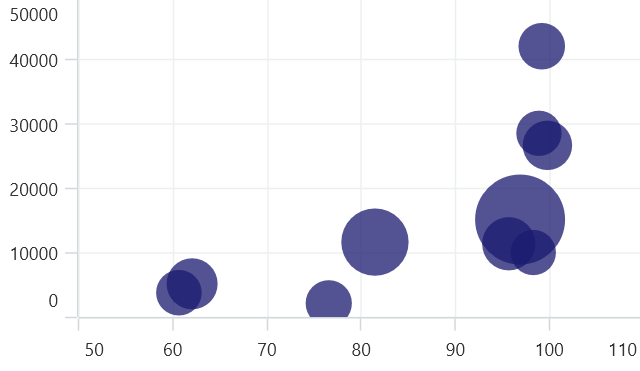
The bubble chart is represented by closely packed circles, whose areas are proportional to the data values they represent. The bubble chart is similar to a scatter plot, but with the additional dimension of bubble size to represent a third variable.
To render a bubble chart, create an instance of BubbleSeries and add it to the Series collection property of SfCartesianChart. The data model must include XValue, YValue, and Size properties; the bubble size is proportional to the value bound via the SizeValuePath property. You can constrain the bubble size using the MinimumRadius (default 3) and MaximumRadius (default 10) properties. The following code shows how to configure these properties.
NOTE
Prerequisite: Ensure that the required NuGet package is installed, the necessary namespaces are imported, and the SfCartesianChart control is properly configured in your application. For detailed setup and configuration instructions, refer to the Getting Started guide.
NOTE
The Cartesian chart has Series as its default content.
<chart:SfCartesianChart>

    <chart:SfCartesianChart.XAxes>
        <chart:NumericalAxis/>
    </chart:SfCartesianChart.XAxes>

    <chart:SfCartesianChart.YAxes>
        <chart:NumericalAxis/>
    </chart:SfCartesianChart.YAxes>

    <chart:BubbleSeries ItemsSource="{Binding Data}"
                        XBindingPath="XValue"
                        YBindingPath="YValue"
                        SizeValuePath="Size"/>

</chart:SfCartesianChart>
SfCartesianChart chart = new SfCartesianChart();
NumericalAxis primaryAxis = new NumericalAxis();
chart.XAxes.Add(primaryAxis);
NumericalAxis secondaryAxis = new NumericalAxis();
chart.YAxes.Add(secondaryAxis);
BubbleSeries series = new BubbleSeries()
{
ItemsSource = new ViewModel().Data,
XBindingPath = "XValue",
YBindingPath = "YValue",
SizeValuePath = "Size",
};
chart.Series.Add(series);
this.Content = chart;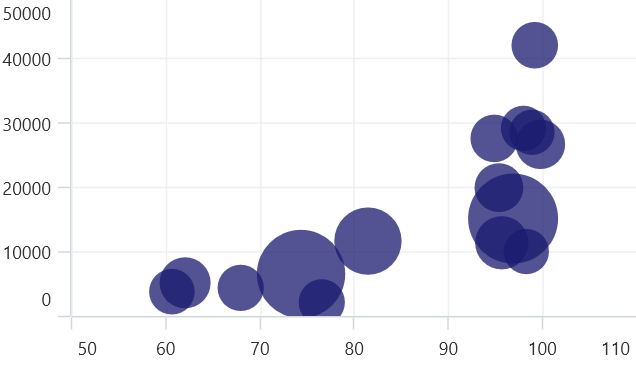
Show zero size bubbles
When the Size value of a data point is 0 or null, the bubble is referred to as a zero-size bubble. The zero-size bubble segments can be enabled or disabled using the ShowZeroSizeBubbles property. By default, the property value is True. The following code shows how to disable zero-size bubbles.
<chart:SfCartesianChart>
    <!-- code omitted for brevity -->
    <chart:BubbleSeries ItemsSource="{Binding Data}"
                        XBindingPath="XValue"
                        YBindingPath="YValue"
                        SizeValuePath="Size"
                        ShowZeroSizeBubbles="False"/>
</chart:SfCartesianChart>
SfCartesianChart chart = new SfCartesianChart();
// code omitted for brevity
BubbleSeries bubbleSeries = new BubbleSeries()
{
ItemsSource = new ViewModel().Data,
XBindingPath = "XValue",
YBindingPath = "YValue",
SizeValuePath = "Size",
ShowZeroSizeBubbles = false,
};
chart.Series.Add(bubbleSeries);
this.Content = chart;