Range Area Chart in .NET MAUI Cartesian Chart
10 Jul 20267 minutes to read
Range Area Chart
Range Area Chart is a type of data visualization useful for displaying the relationship between two variables over time. In this Series, the area between two lines is filled to indicate a range of values, such as a high and low price range or an upper and lower limit.
By displaying ranges of data, range area series can make it easier to compare multiple datasets at once.
NOTE
Prerequisite: Ensure that the required NuGet package is installed, the necessary namespaces are imported, and the SfCartesianChart control is properly configured in your application. For detailed setup and configuration instructions, refer to the Getting Started guide.
To render a range area chart, create an instance of the RangeAreaSeries, and add it to the Series collection property of the SfCartesianChart.
Since the RangeAreaSeries requires two Y values for each point, your data should contain both the high and low values. These high and low values specify the maximum and minimum ranges of the point.
NOTE
The Cartesian chart has the Series as its default content.
<chart:SfCartesianChart>
    <!-- code omitted for brevity -->
    <chart:SfCartesianChart.XAxes>
        <chart:CategoryAxis/>
    </chart:SfCartesianChart.XAxes>

    <chart:SfCartesianChart.YAxes>
        <chart:NumericalAxis/>
    </chart:SfCartesianChart.YAxes>

    <chart:RangeAreaSeries ItemsSource="{Binding Data}"
                           XBindingPath="XValue"
                           High="HighValue"
                           Low="LowValue"/>
</chart:SfCartesianChart>
SfCartesianChart chart = new SfCartesianChart();
CategoryAxis primaryAxis = new CategoryAxis();
chart.XAxes.Add(primaryAxis);
NumericalAxis secondaryAxis = new NumericalAxis();
chart.YAxes.Add(secondaryAxis);
RangeAreaSeries series = new RangeAreaSeries()
{
ItemsSource = new ViewModel().Data,
XBindingPath = "XValue",
High = "HighValue",
Low = "LowValue",
};
chart.Series.Add(series);
this.Content = chart;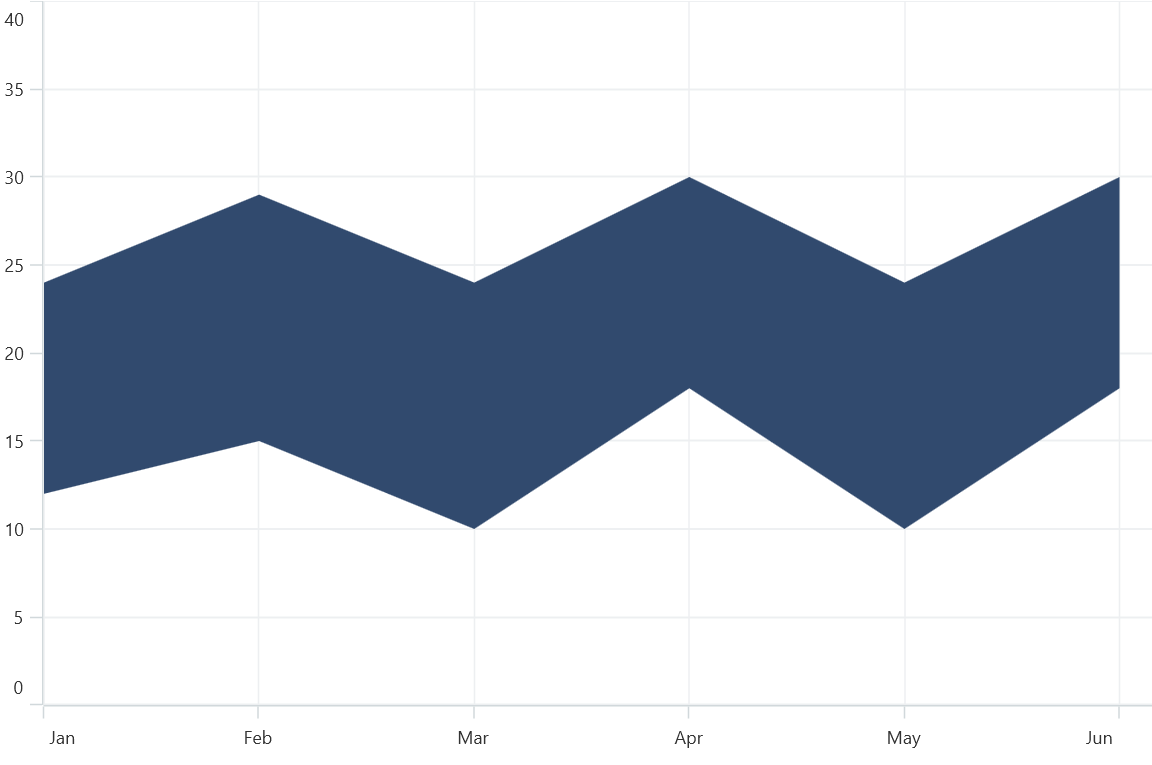
Enable Marker
A marker, also known as a symbol, is used to determine or highlight the position of the data point. To enable markers in the series, set the ShowMarkers property to true.
<chart:SfCartesianChart>
    <!-- code omitted for brevity -->
    <chart:RangeAreaSeries ItemsSource="{Binding Data}"
                           XBindingPath="XValue"
                           High="HighValue"
                           Low="LowValue"
                           ShowMarkers="True"/>
</chart:SfCartesianChart>
SfCartesianChart chart = new SfCartesianChart();
// code omitted for brevity
RangeAreaSeries series = new RangeAreaSeries()
{
ItemsSource = new ViewModel().Data,
XBindingPath = "XValue",
High = "HighValue",
Low = "LowValue",
ShowMarkers = true,
};
chart.Series.Add(series);
this.Content = chart;Marker Customization
To change the series markers appearance, create an instance of the MarkerSettings property. The following properties are used to customize marker appearance.
-
Type, of type
ShapeType, describes the shape of the series marker. The default value of this property is the ShapeType.Circle. -
Stroke, of type
Brush, indicates the brush used to paint the marker border. -
StrokeWidth, of type
double, indicates the width of the marker border. -
Fill, of type
Brush, indicates the color of the marker. -
Width, of type
double, indicates the width of the marker. -
Height, of type
double, indicates the height of the marker.
<chart:SfCartesianChart>
    <!-- code omitted for brevity -->
    <chart:RangeAreaSeries ItemsSource="{Binding Data}"
                           XBindingPath="XValue"
                           High="HighValue"
                           Low="LowValue"
                           ShowMarkers="True">
        <chart:RangeAreaSeries.MarkerSettings>
            <chart:ChartMarkerSettings Type="Diamond"
                                       Fill="Brown"
                                       Stroke="Black"
                                       StrokeWidth="1"
                                       Height="8"
                                       Width="8"/>
        </chart:RangeAreaSeries.MarkerSettings>
    </chart:RangeAreaSeries>
</chart:SfCartesianChart>
SfCartesianChart chart = new SfCartesianChart();
// code omitted for brevity
ChartMarkerSettings chartMarker= new ChartMarkerSettings()
{
Type = ShapeType.Diamond,
Fill = Colors.Brown,
Stroke = Colors.Black,
StrokeWidth = 1,
Height = 8,
Width = 8
};
RangeAreaSeries series = new RangeAreaSeries()
{
ItemsSource = new ViewModel().Data,
XBindingPath = "XValue",
High = "HighValue",
Low = "LowValue",
ShowMarkers = true,
MarkerSettings = chartMarker
};
chart.Series.Add(series);
this.Content = chart;