Stacked Line Chart in .NET MAUI Cartesian Chart
18 Nov 201816 minutes to read
Stacked Line Chart
The stacked line chart is a type of chart that displays multiple line series stacked on top of each other, with the values of each series combined to show a cumulative value of the data points.
To render a stacked line chart, create an instance of the StackingLineSeries and add it to the Series collection property of the SfCartesianChart.
Prerequisite: Ensure that the required NuGet package is installed, the necessary namespaces are imported, and the SfCartesianChart control is properly configured in your application. For detailed setup and configuration instructions, refer to the Getting Started guide.
The Cartesian chart has a Series as its default content.
<chart:SfCartesianChart>

    <chart:SfCartesianChart.XAxes>
        <chart:CategoryAxis/>
    </chart:SfCartesianChart.XAxes>

    <chart:SfCartesianChart.YAxes>
        <chart:NumericalAxis/>
    </chart:SfCartesianChart.YAxes>

    <chart:StackingLineSeries ItemsSource="{Binding Data1}"
                              XBindingPath="Month"
                              YBindingPath="Value"/>

    <chart:StackingLineSeries ItemsSource="{Binding Data2}"
                              XBindingPath="Month"
                              YBindingPath="Value"/>

    <chart:StackingLineSeries ItemsSource="{Binding Data3}"
                              XBindingPath="Month"
                              YBindingPath="Value"/>

    <chart:StackingLineSeries ItemsSource="{Binding Data4}"
                              XBindingPath="Month"
                              YBindingPath="Value"/>
</chart:SfCartesianChart>
SfCartesianChart chart = new SfCartesianChart();
CategoryAxis primaryAxis = new CategoryAxis();
chart.XAxes.Add(primaryAxis);
NumericalAxis secondaryAxis = new NumericalAxis();
chart.YAxes.Add(secondaryAxis);
ViewModel viewModel = new ViewModel();
StackingLineSeries series1 = new StackingLineSeries()
{
ItemsSource = viewModel.Data1,
XBindingPath = "Month",
YBindingPath = "Value",
};
StackingLineSeries series2 = new StackingLineSeries()
{
ItemsSource = viewModel.Data2,
XBindingPath = "Month",
YBindingPath = "Value",
};
StackingLineSeries series3 = new StackingLineSeries()
{
ItemsSource = viewModel.Data3,
XBindingPath = "Month",
YBindingPath = "Value",
};
StackingLineSeries series4 = new StackingLineSeries()
{
ItemsSource = viewModel.Data4,
XBindingPath = "Month",
YBindingPath = "Value",
};
chart.Series.Add(series1);
chart.Series.Add(series2);
chart.Series.Add(series3);
chart.Series.Add(series4);
this.Content = chart;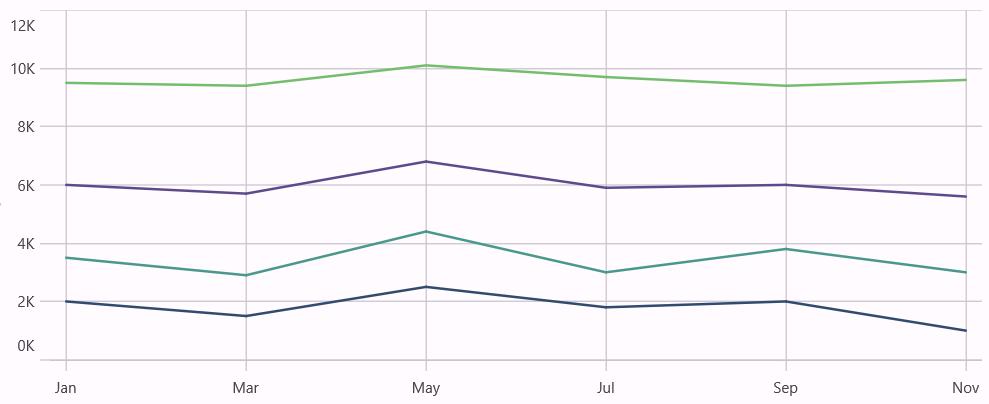
Dashed Stacked Line
The StrokeDashArray property of StackingLineSeries is used to render the stacked line series with dashes. Odd value is considered as rendering size and even value is considered as gap.
<chart:SfCartesianChart>
    <chart:SfCartesianChart.Resources>
        <DoubleCollection x:Key="dashArray">
            <x:Double>5</x:Double>
            <x:Double>2</x:Double>
        </DoubleCollection>
    </chart:SfCartesianChart.Resources>

    <chart:SfCartesianChart.XAxes>
        <chart:CategoryAxis />
    </chart:SfCartesianChart.XAxes>

    <chart:SfCartesianChart.YAxes>
        <chart:NumericalAxis />
    </chart:SfCartesianChart.YAxes>

    <chart:StackingLineSeries ItemsSource="{Binding Data1}"
                              XBindingPath="Month"
                              YBindingPath="Value"
                              StrokeDashArray="{StaticResource dashArray}"/>

    <chart:StackingLineSeries ItemsSource="{Binding Data2}"
                              XBindingPath="Month"
                              YBindingPath="Value"
                              StrokeDashArray="{StaticResource dashArray}"/>

    <chart:StackingLineSeries ItemsSource="{Binding Data3}"
                              XBindingPath="Month"
                              YBindingPath="Value"
                              StrokeDashArray="{StaticResource dashArray}"/>

    <chart:StackingLineSeries ItemsSource="{Binding Data4}"
                              XBindingPath="Month"
                              YBindingPath="Value"
                              StrokeDashArray="{StaticResource dashArray}"/>
</chart:SfCartesianChart>
SfCartesianChart chart = new SfCartesianChart();
CategoryAxis primaryAxis = new CategoryAxis();
chart.XAxes.Add(primaryAxis);
NumericalAxis secondaryAxis = new NumericalAxis();
chart.YAxes.Add(secondaryAxis);
ViewModel viewModel = new ViewModel();
DoubleCollection doubleCollection = new DoubleCollection();
doubleCollection.Add(5);
doubleCollection.Add(2);
StackingLineSeries series1 = new StackingLineSeries()
{
ItemsSource = viewModel.Data1,
XBindingPath = "Month",
YBindingPath = "Value",
StrokeDashArray = doubleCollection
};
StackingLineSeries series2 = new StackingLineSeries()
{
ItemsSource = viewModel.Data2,
XBindingPath = "Month",
YBindingPath = "Value",
StrokeDashArray = doubleCollection
};
StackingLineSeries series3 = new StackingLineSeries()
{
ItemsSource = viewModel.Data3,
XBindingPath = "Month",
YBindingPath = "Value",
StrokeDashArray = doubleCollection
};
StackingLineSeries series4 = new StackingLineSeries()
{
ItemsSource = viewModel.Data4,
XBindingPath = "Month",
YBindingPath = "Value",
StrokeDashArray = doubleCollection
};
chart.Series.Add(series1);
chart.Series.Add(series2);
chart.Series.Add(series3);
chart.Series.Add(series4);
this.Content = chart;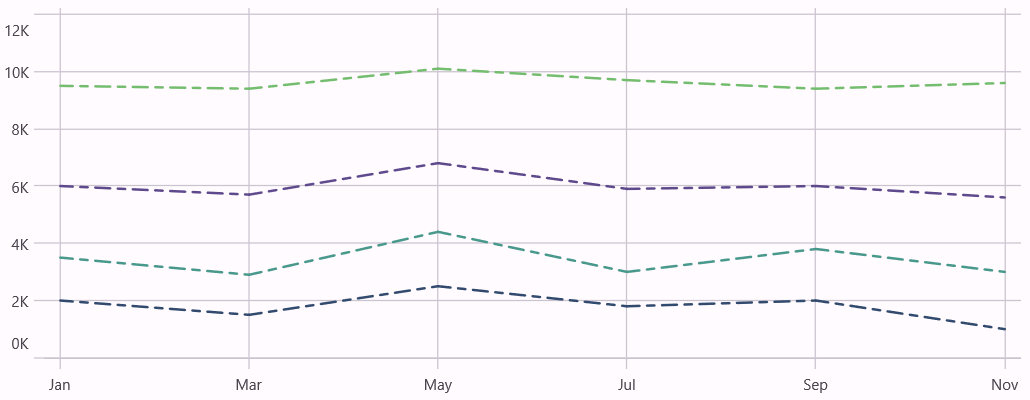
Enable Marker
A marker, also known as a symbol, is used to determine or highlight the position of the data point. To enable markers in the series, set the ShowMarkers property to true.
<chart:SfCartesianChart>
    <!-- code omitted for brevity -->
    <chart:StackingLineSeries ItemsSource="{Binding Data1}"
                              XBindingPath="Month"
                              YBindingPath="Value"
                              ShowMarkers="True"/>

    <chart:StackingLineSeries ItemsSource="{Binding Data2}"
                              XBindingPath="Month"
                              YBindingPath="Value"
                              ShowMarkers="True"/>

    <chart:StackingLineSeries ItemsSource="{Binding Data3}"
                              XBindingPath="Month"
                              YBindingPath="Value"
                              ShowMarkers="True"/>

    <chart:StackingLineSeries ItemsSource="{Binding Data4}"
                              XBindingPath="Month"
                              YBindingPath="Value"
                              ShowMarkers="True"/>
</chart:SfCartesianChart>
SfCartesianChart chart = new SfCartesianChart();
ViewModel viewModel = new ViewModel();
// code omitted for brevity
StackingLineSeries series1 = new StackingLineSeries()
{
ItemsSource = viewModel.Data1,
XBindingPath = "Month",
YBindingPath = "Value",
ShowMarkers = true,
};
StackingLineSeries series2 = new StackingLineSeries()
{
ItemsSource = viewModel.Data2,
XBindingPath = "Month",
YBindingPath = "Value",
ShowMarkers = true,
};
StackingLineSeries series3 = new StackingLineSeries()
{
ItemsSource = viewModel.Data3,
XBindingPath = "Month",
YBindingPath = "Value",
ShowMarkers = true,
};
StackingLineSeries series4 = new StackingLineSeries()
{
ItemsSource = viewModel.Data4,
XBindingPath = "Month",
YBindingPath = "Value",
ShowMarkers = true,
};
chart.Series.Add(series1);
chart.Series.Add(series2);
chart.Series.Add(series3);
chart.Series.Add(series4);
this.Content = chart;
Marker customization
To change the series markers appearance, create an instance of the MarkerSettings property. The following properties are used to customize marker appearance.
-
Type, of type
ShapeType, describes the shape of the series marker. The default value of this property is ShapeType.Circle. -
Stroke, of type
Brush, indicates the brush used to paint the marker border. -
StrokeWidth, of type
double, indicates the width of the marker border. -
Fill, of type
Brush, indicates the color of the marker. -
Width, of type
double, indicates the width of the marker. -
Height, of type
double, indicates the height of the marker.
<chart:SfCartesianChart>
    <!-- code omitted for brevity -->
    <chart:StackingLineSeries ItemsSource="{Binding Data1}"
                                XBindingPath="Month"
                                YBindingPath="Value"
                                ShowMarkers="True">
        <chart:StackingLineSeries.MarkerSettings>
            <chart:ChartMarkerSettings Type="Diamond"
                                        StrokeWidth="2"
                                        Fill="White"
                                        Height="8"
                                        Width="8"/>
        </chart:StackingLineSeries.MarkerSettings>
    </chart:StackingLineSeries>
</chart:SfCartesianChart>
SfCartesianChart chart = new SfCartesianChart();
ViewModel viewModel = new ViewModel();
// code omitted for brevity
ChartMarkerSettings chartMarker= new ChartMarkerSettings()
{
Type = ShapeType.Diamond,
Fill = Colors.Brown,
Stroke = Colors.Black,
StrokeWidth = 1,
Height = 8,
Width = 8
};
StackingLineSeries series = new StackingLineSeries()
{
XBindingPath = "Month",
YBindingPath = "Value",
ItemsSource = viewModel.Data1,
ShowMarkers = true,
MarkerSettings = chartMarker,
};
chart.Series.Add(series);
this.Content = chart;