Histogram Chart in .NET MAUI Cartesian Chart
10 Jul 20264 minutes to read
Histogram chart is a graphical representation that organizes a group of data points into user-specified ranges. It is similar in appearance to a column chart.
NOTE
Prerequisite: Ensure that the required NuGet package is installed, the necessary namespaces are imported, and the SfCartesianChart control is properly configured in your application. For detailed setup and configuration instructions, refer to the Getting Started guide.
Customize histogram intervals using the HistogramInterval property and normal distribution curve can be collapsed using the ShowNormalDistributionCurve property.
<chart:SfCartesianChart>
    <chart:SfCartesianChart.XAxes>
        <chart:NumericalAxis/>
    </chart:SfCartesianChart.XAxes>

    <chart:SfCartesianChart.YAxes>
        <chart:NumericalAxis/>
    </chart:SfCartesianChart.YAxes>

    <chart:HistogramSeries ItemsSource="{Binding HistogramData}"
                           XBindingPath="Value"
                           YBindingPath="Size"
                           HistogramInterval="20"
                           ShowNormalDistributionCurve="True"/>
</chart:SfCartesianChart>
SfCartesianChart chart = new SfCartesianChart();
NumericalAxis xAxis = new NumericalAxis();
chart.XAxes.Add(xAxis);
NumericalAxis yAxis = new NumericalAxis();
chart.YAxes.Add(yAxis);
HistogramSeries histogramSeries = new HistogramSeries
{
ItemsSource = new ViewModel().HistogramData,
XBindingPath = "Value",
YBindingPath = "Size",
HistogramInterval = 20,
ShowNormalDistributionCurve = true
};
chart.Series.Add(histogramSeries);
this.Content = chart;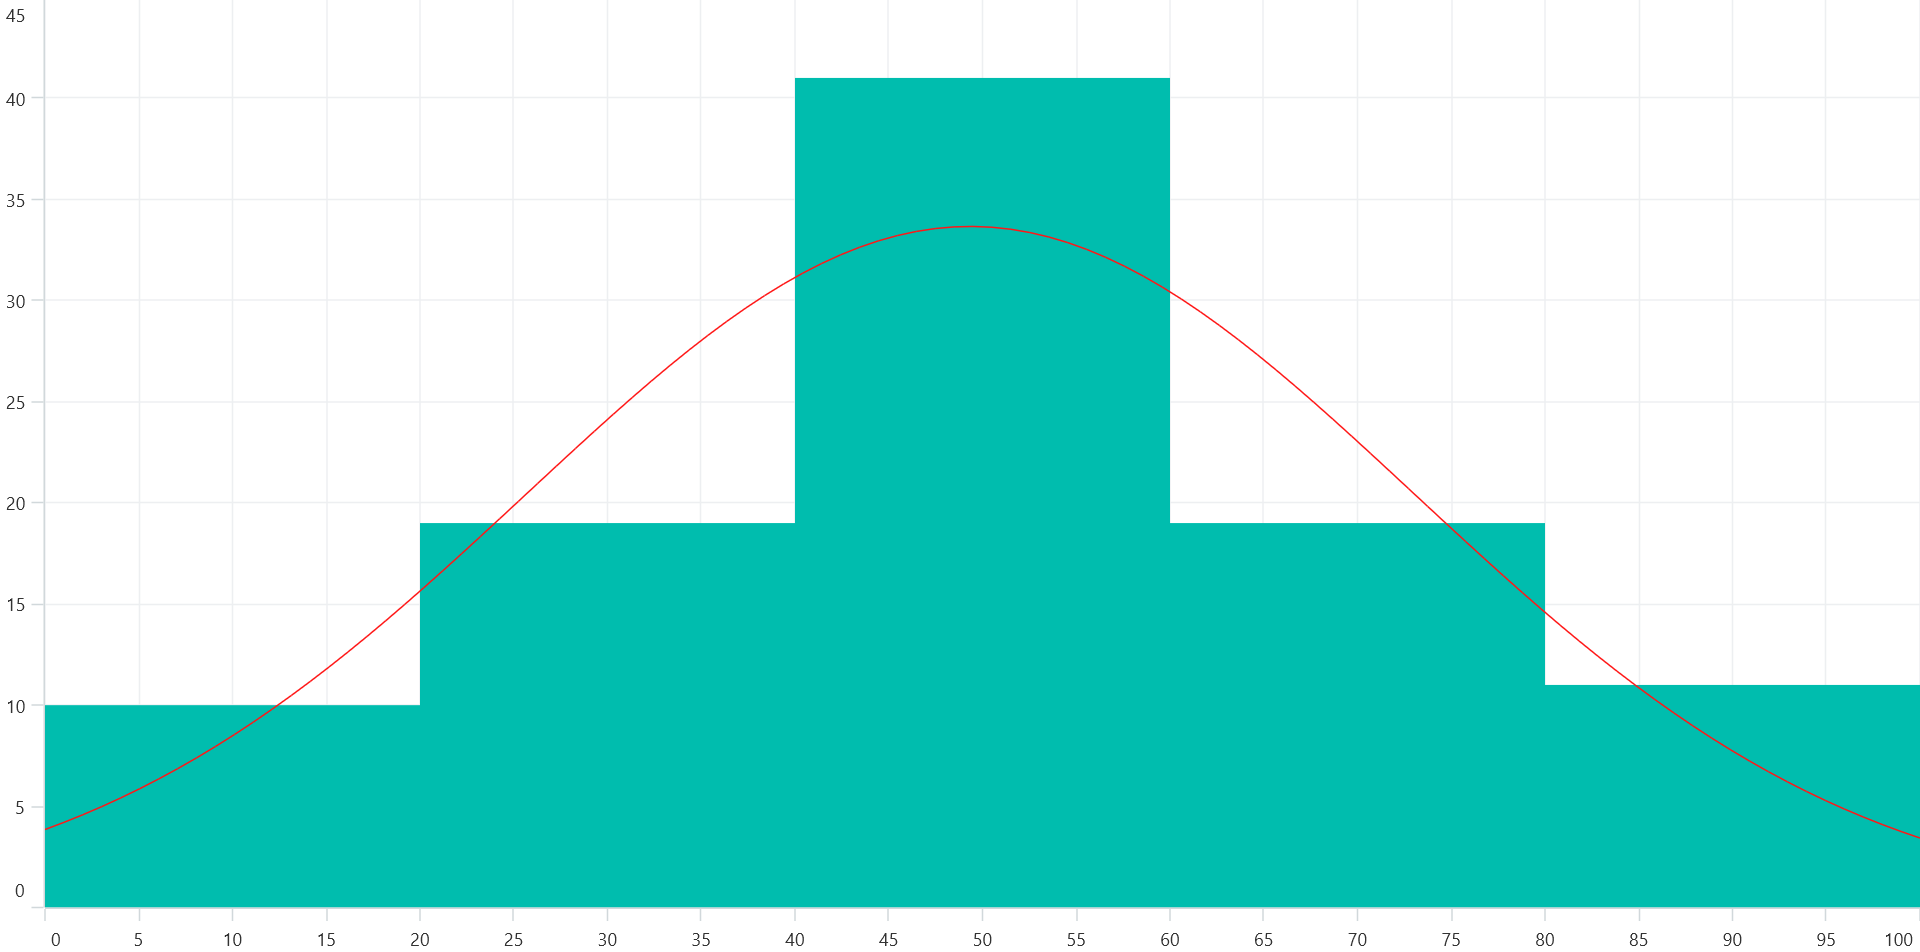
Customization of distribution curve
Customize the normal distribution curve by using the CurveLineStyle property.
<chart:SfCartesianChart>
    <!-- code omitted for brevity -->
    <chart:HistogramSeries ItemsSource="{Binding HistogramData}"
                           XBindingPath="Value"
                           YBindingPath="Size"
                           HistogramInterval="20"
                           ShowNormalDistributionCurve="True">
        <chart:HistogramSeries.CurveStyle>
            <chart:ChartLineStyle Stroke="Blue"
                                  StrokeWidth="2"
                                  StrokeDashArray="5,6,3">
            </chart:ChartLineStyle>
        </chart:HistogramSeries.CurveStyle>
    </chart:HistogramSeries>
</chart:SfCartesianChart>
SfCartesianChart chart = new SfCartesianChart();
//code omitted for brevity
HistogramSeries histogramSeries = new HistogramSeries
{
ItemsSource = new ViewModel().HistogramData,
XBindingPath = "Value",
YBindingPath = "Size",
HistogramInterval = 20,
ShowNormalDistributionCurve = true,
CurveStyle = new ChartLineStyle()
{
Stroke = Colors.Blue,
StrokeWidth = 2,
StrokeDashArray = new double[] { 5, 6, 3 }
}
};
chart.Series.Add(histogramSeries);
this.Content = chart;