Error Bar in .NET MAUI Cartesian Chart
10 Jul 202621 minutes to read
Error Bar Chart
ErrorBarSeries indicates the errors or uncertainty in reported values. This will find the possible variations in measurements, and in the chart control, these values are displayed as data points. The HorizontalErrorValue and the VerticalErrorValue are used to set the error value (variation) in the series.
NOTE
The Error Bar is not an individual chart; it associates with a main chart. Here, we use
Scatter Series Chartas the main chart with the Error Bar Series chart support.
NOTE
Prerequisite: Ensure that the required NuGet package is installed, the necessary namespaces are imported, and the SfCartesianChart control is properly configured in your application. For detailed setup and configuration instructions, refer to the Getting Started guide.
The following code examples illustrate how to create an error bar series:
<chart:SfCartesianChart>

    <chart:SfCartesianChart.XAxes>
        <chart:NumericalAxis/>
    </chart:SfCartesianChart.XAxes>

    <chart:SfCartesianChart.YAxes>
        <chart:NumericalAxis/>
    </chart:SfCartesianChart.YAxes>

    <chart:ScatterSeries ItemsSource="{Binding EnergyProductions}"
                         XBindingPath="ID"
                         YBindingPath="Coal"
                         PointHeight="20"
                         PointWidth="20"/>
    <chart:ErrorBarSeries ItemsSource="{Binding EnergyProductions}"
                          XBindingPath="ID"
                          YBindingPath="Coal"
                          VerticalErrorValue="50"
                          HorizontalErrorValue="0.5"/>

</chart:SfCartesianChart>
SfCartesianChart chart = new SfCartesianChart();
NumericalAxis primaryAxis = new NumericalAxis();
chart.XAxes.Add(primaryAxis);
NumericalAxis secondaryAxis = new NumericalAxis();
chart.YAxes.Add(secondaryAxis);
ScatterSeries series = new ScatterSeries()
{
ItemsSource = new ViewModel().EnergyProductions,
XBindingPath = "ID",
YBindingPath = "Coal",
PointWidth = 20,
PointHeight = 20
};
ErrorBarSeries errorBar = new ErrorBarSeries()
{
ItemsSource = new ViewModel().EnergyProductions,
XBindingPath = "ID",
YBindingPath = "Coal",
HorizontalErrorValue = 0.5,
VerticalErrorValue = 50
};
chart.Series.Add(series);
chart.Series.Add(errorBar);
this.Content = chart;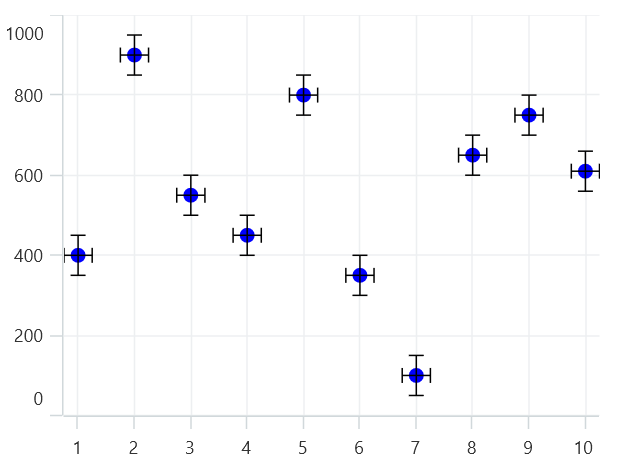
Mode
The error bar mode specifies whether the error bar should be drawn horizontally, vertically, or both. The Mode property is used to switch the error bar mode. By default, the Mode value is Both, which will display both horizontal and vertical error values.
Both
To view both the horizontal and vertical error value, you can set the Mode as Both as shown in the following code example.
<chart:ErrorBarSeries ItemsSource="{Binding EnergyProductions}"
                      XBindingPath="ID"
                      YBindingPath="Coal"
                      VerticalErrorValue="50"
                      HorizontalErrorValue="0.5"
                      Mode="Both">
</chart:ErrorBarSeries>
ErrorBarSeries errorBar = new ErrorBarSeries()
{
ItemsSource = new ViewModel().EnergyProductions,
XBindingPath = "ID",
YBindingPath = "Coal",
HorizontalErrorValue = 0.5,
VerticalErrorValue = 50,
Mode = ErrorBarMode.Both
};
chart.Series.Add(errorBar);
Horizontal
To view horizontal error value, you can set the Mode as Horizontal as shown in the following code example.
<chart:ErrorBarSeries ItemsSource="{Binding EnergyProductions}"
                      XBindingPath="ID"
                      YBindingPath="Coal"
                      VerticalErrorValue="50"
                      HorizontalErrorValue="0.5"
                      Mode="Horizontal">
</chart:ErrorBarSeries>
ErrorBarSeries errorBar = new ErrorBarSeries()
{
ItemsSource = new ViewModel().EnergyProductions,
XBindingPath = "ID",
YBindingPath = "Coal",
HorizontalErrorValue = 0.5,
VerticalErrorValue = 50,
Mode = ErrorBarMode.Horizontal
};
chart.Series.Add(errorBar);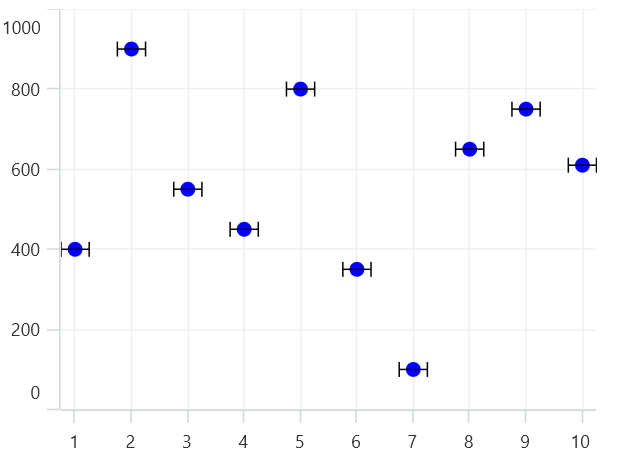
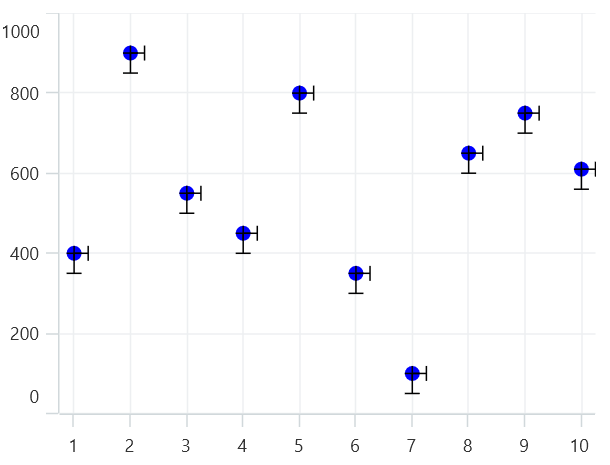
Vertical
To view vertical error value, you can set the Mode as Vertical, as shown in the following code example.
<chart:ErrorBarSeries ItemsSource="{Binding EnergyProductions}"
                      XBindingPath="ID"
                      YBindingPath="Coal"
                      VerticalErrorValue="50"
                      HorizontalErrorValue="0.5"
                      Mode="Vertical">
</chart:ErrorBarSeries>
ErrorBarSeries errorBar = new ErrorBarSeries()
{
ItemsSource = new ViewModel().EnergyProductions,
XBindingPath = "ID",
YBindingPath = "Coal",
HorizontalErrorValue = 0.5,
VerticalErrorValue = 50,
Mode = ErrorBarMode.Vertical
};
chart.Series.Add(errorBar);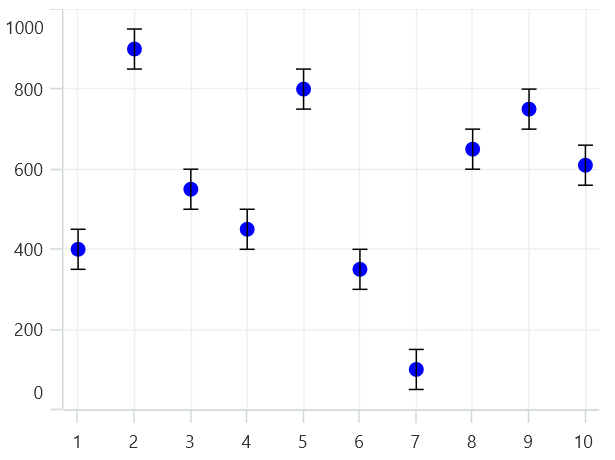
Direction
The HorizontalDirection and VerticalDirection specify whether to show positive, negative, or both directions of error values.
ErrorBarDirection contains the following values:
-
Both- It indicates the actual data point value along with a specific amount of positive and negative error values. -
Plus- It indicates the actual data point value along with a specific amount of positive error value. -
Minus- It indicates the actual data point value along with a specific amount of negative error value.
The following code illustrates how to set the HorizontalDirection and the VerticalDirection values to error bar chart.
<chart:ErrorBarSeries ItemsSource="{Binding EnergyProductions}"
                      XBindingPath="ID"
                      YBindingPath="Coal"
                      VerticalErrorValue="50"
                      HorizontalErrorValue="0.5"
                      HorizontalDirection="Plus"
                      VerticalDirection="Minus">
</chart:ErrorBarSeries>
ErrorBarSeries errorBar = new ErrorBarSeries()
{
ItemsSource = new ViewModel().EnergyProductions,
XBindingPath = "ID",
YBindingPath = "Coal",
HorizontalErrorValue = 0.5,
VerticalErrorValue = 50,
HorizontalDirection = ErrorBarDirection.Plus,
VerticalDirection = ErrorBarDirection.Minus,
};
Type
The Type property is used to define the error bar type value in Fixed, Custom, Percentage, StandardDeviation, and StandardErrors. The default value of this property is Fixed. For all types, you have to set the values for HorizontalErrorValue and VerticalErrorValue except Custom.
Fixed
<chart:ErrorBarSeries ItemsSource="{Binding EnergyProductions}"
                      XBindingPath="ID"
                      YBindingPath="Coal"
                      VerticalErrorValue="50"
                      HorizontalErrorValue="0.5"
                      Type="Fixed">
</chart:ErrorBarSeries>
ErrorBarSeries errorBar = new ErrorBarSeries()
{
ItemsSource = new ViewModel().EnergyProductions,
XBindingPath = "ID",
YBindingPath = "Coal",
HorizontalErrorValue = 0.5,
VerticalErrorValue = 50,
Type = ErrorBarType.Fixed
};
chart.Series.Add(errorBar);
Percentage
<chart:ErrorBarSeries ItemsSource="{Binding EnergyProductions}"
                      XBindingPath="ID"
                      YBindingPath="Coal"
                      VerticalErrorValue="50"
                      HorizontalErrorValue="0.5"
                      Type="Percentage">
</chart:ErrorBarSeries>
ErrorBarSeries errorBar = new ErrorBarSeries()
{
ItemsSource = new ViewModel().EnergyProductions,
XBindingPath = "ID",
YBindingPath = "Coal",
HorizontalErrorValue = 0.5,
VerticalErrorValue = 50,
Type = ErrorBarType.Percentage
};
chart.Series.Add(errorBar);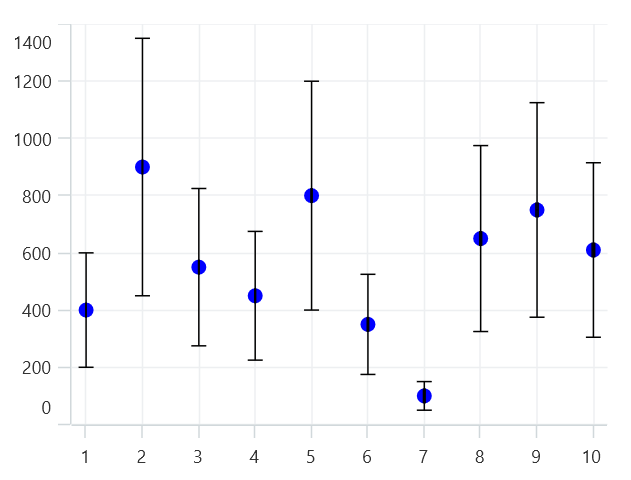
Standard Error
<chart:ErrorBarSeries ItemsSource="{Binding EnergyProductions}"
                      XBindingPath="ID"
                      YBindingPath="Coal"
                      VerticalErrorValue="50"
                      HorizontalErrorValue="0.5"
                      Type="StandardError">
</chart:ErrorBarSeries>
ErrorBarSeries errorBar = new ErrorBarSeries()
{
ItemsSource = new ViewModel().EnergyProductions,
XBindingPath = "ID",
YBindingPath = "Coal",
HorizontalErrorValue = 0.5,
VerticalErrorValue = 50,
Type = ErrorBarType.StandardError
};
chart.Series.Add(errorBar);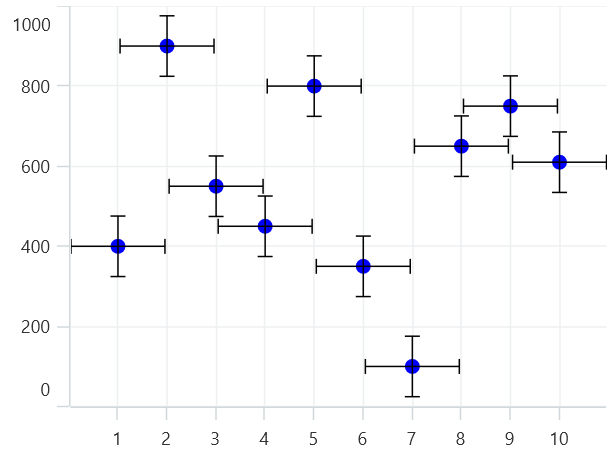
Standard Deviation
<chart:ErrorBarSeries ItemsSource="{Binding EnergyProductions}"
                      XBindingPath="ID"
                      YBindingPath="Coal"
                      VerticalErrorValue="50"
                      HorizontalErrorValue="0.5"
                      Type="StandardDeviation">
</chart:ErrorBarSeries>
ErrorBarSeries errorBar = new ErrorBarSeries()
{
ItemsSource = new ViewModel().EnergyProductions,
XBindingPath = "ID",
YBindingPath = "Coal",
HorizontalErrorValue = 0.5,
VerticalErrorValue = 50,
Type = ErrorBarType.StandardDeviation
};
chart.Series.Add(errorBar);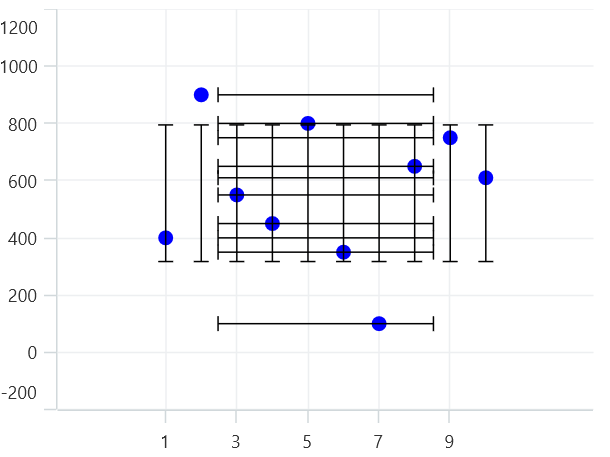
Custom
If the Type is Custom, you have to bind the HorizontalErrorPath and the VerticalErrorPath as shown in the following code sample.
<chart:ErrorBarSeries ItemsSource="{Binding EnergyProductions}"
                      XBindingPath="ID"
                      YBindingPath="Coal"
                      VerticalErrorValue="50"
                      HorizontalErrorValue="0.5"
                      Type="Custom"
                      HorizontalErrorPath="HorizontalErrorValue"
                      VerticalErrorPath="VerticalErrorValue">
</chart:ErrorBarSeries>
ErrorBarSeries errorBar = new ErrorBarSeries()
{
ItemsSource = new ViewModel().EnergyProductions,
XBindingPath = "ID",
YBindingPath = "Coal",
HorizontalErrorValue = 0.5,
VerticalErrorValue = 50,
Type = ErrorBarType.Custom,
HorizontalErrorPath = "HorizontalErrorValue",
VerticalErrorPath = "VerticalErrorValue"
};
chart.Series.Add(errorBar);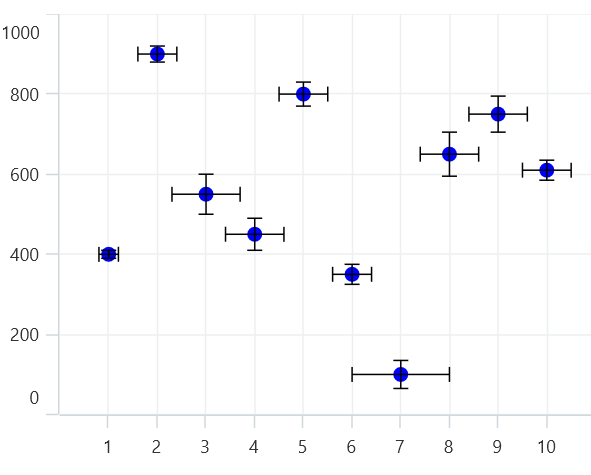
Customization
Line Style
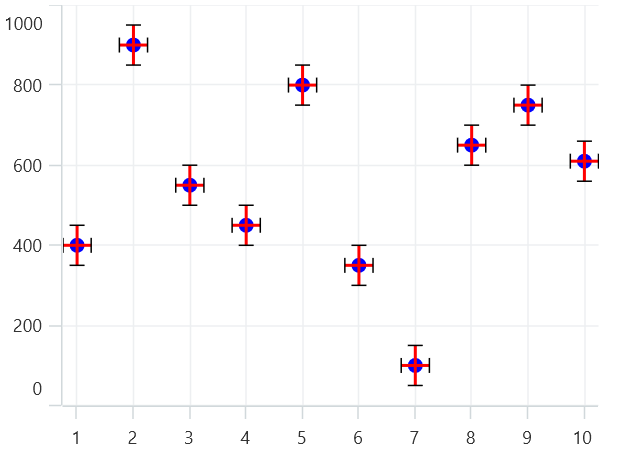
You can define the LineStyle for the error bar lines using the HorizontalLineStyle and the VerticalLineStyle properties as in the following code examples.
<chart:ErrorBarSeries ItemsSource="{Binding EnergyProductions}"
                      XBindingPath="ID"
                      YBindingPath="Coal"
                      VerticalErrorValue="50"
                      HorizontalErrorValue="0.5">

    <chart:ErrorBarSeries.HorizontalLineStyle>
        <chart:ErrorBarLineStyle Stroke="Red"  StrokeWidth="2"/>
    </chart:ErrorBarSeries.HorizontalLineStyle>

    <chart:ErrorBarSeries.VerticalLineStyle>
        <chart:ErrorBarLineStyle Stroke="Red"  StrokeWidth="2"/>
    </chart:ErrorBarSeries.VerticalLineStyle>
</chart:ErrorBarSeries>
ErrorBarSeries errorBar = new ErrorBarSeries()
{
ItemsSource = new ViewModel().EnergyProductions,
XBindingPath = "ID",
YBindingPath = "Coal",
HorizontalErrorValue = 0.5,
VerticalErrorValue = 50,
};
errorBar.HorizontalLineStyle = new ErrorBarLineStyle()
{
Stroke = new SolidColorBrush(Colors.Red),
StrokeWidth = 2
};
errorBar.VerticalLineStyle = new ErrorBarLineStyle()
{
Stroke = new SolidColorBrush(Colors.Red),
StrokeWidth = 2
};
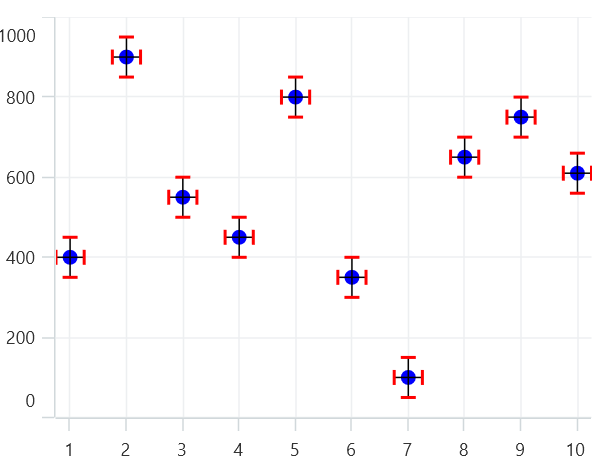
Cap Line Style
You can define the CapLineStyle for the error bar lines using the HorizontalCapLineStyle and the VerticalCapLineStyle properties as in the following code examples.
<chart:ErrorBarSeries ItemsSource="{Binding EnergyProductions}"
                      XBindingPath="ID"
                      YBindingPath="Coal"
                      VerticalErrorValue="50"
                      HorizontalErrorValue="0.5">
    <chart:ErrorBarSeries.HorizontalCapLineStyle>
        <chart:ErrorBarCapLineStyle Stroke="Red"
                                    StrokeWidth="2">
        </chart:ErrorBarCapLineStyle>
    </chart:ErrorBarSeries.HorizontalCapLineStyle>
    <chart:ErrorBarSeries.VerticalCapLineStyle>
        <chart:ErrorBarCapLineStyle Stroke="Red"
                                    StrokeWidth="2">
        </chart:ErrorBarCapLineStyle>
    </chart:ErrorBarSeries.VerticalCapLineStyle>
</chart:ErrorBarSeries>
ErrorBarSeries errorBar = new ErrorBarSeries()
{
ItemsSource = new ViewModel().EnergyProductions,
XBindingPath = "ID",
YBindingPath = "Coal",
HorizontalErrorValue = 0.5,
VerticalErrorValue = 50,
};
errorBar.HorizontalCapLineStyle = new ErrorBarCapLineStyle()
{
Stroke = new SolidColorBrush(Colors.Red),
StrokeWidth = 2
};
errorBar.VerticalCapLineStyle = new ErrorBarCapLineStyle()
{
Stroke = new SolidColorBrush(Colors.Red),
StrokeWidth = 2
};