Column Chart in .NET MAUI Cartesian Chart
10 Jul 20266 minutes to read
Column Chart
A column chart is used to plot discrete rectangles for the given data point values. To render a column chart, create an instance of ColumnSeries and add it to the Series collection property of SfCartesianChart.
NOTE
Prerequisite: Ensure that the required NuGet package is installed, the necessary namespaces are imported, and the SfCartesianChart control is properly configured in your application. For detailed setup and configuration instructions, refer to the Getting Started guide.
NOTE
The Cartesian chart has Series as its default content.
<chart:SfCartesianChart>
    <chart:SfCartesianChart.XAxes>
        <chart:CategoryAxis/>
    </chart:SfCartesianChart.XAxes>

    <chart:SfCartesianChart.YAxes>
        <chart:NumericalAxis/>
    </chart:SfCartesianChart.YAxes>

    <chart:ColumnSeries ItemsSource="{Binding Data}"
                        XBindingPath="XValue"
                        YBindingPath="YValue"/>
</chart:SfCartesianChart>
SfCartesianChart chart = new SfCartesianChart();
CategoryAxis primaryAxis = new CategoryAxis();
chart.XAxes.Add(primaryAxis);
NumericalAxis secondaryAxis = new NumericalAxis();
chart.YAxes.Add(secondaryAxis);
ColumnSeries series = new ColumnSeries()
{
ItemsSource = new ViewModel().Data,
XBindingPath = "XValue",
YBindingPath = "YValue",
};
chart.Series.Add(series);
this.Content = chart;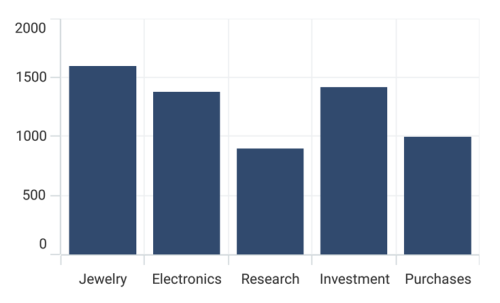
Spacing and Width
The Spacing property is used to change the spacing between two segments. The default value of the spacing is 0, and the value ranges from 0 to 1. Here, 1 and 0 correspond to 100% and 0% of the available space, respectively.
The Width property is used to change the width of the rectangle. The default value of the width is 0.8, and the value ranges from 0 to 1.
<chart:SfCartesianChart>

    <chart:SfCartesianChart.XAxes>
        <chart:CategoryAxis/>
    </chart:SfCartesianChart.XAxes>

    <chart:SfCartesianChart.YAxes>
        <chart:NumericalAxis/>
    </chart:SfCartesianChart.YAxes>

    <chart:ColumnSeries ItemsSource="{Binding Data}"
                        XBindingPath="XValue"
                        YBindingPath="YValue"
                        Spacing="0.5"
                        Width="0.6"/>

</chart:SfCartesianChart>
SfCartesianChart chart = new SfCartesianChart();
CategoryAxis primaryAxis = new CategoryAxis();
chart.XAxes.Add(primaryAxis);
NumericalAxis secondaryAxis = new NumericalAxis();
chart.YAxes.Add(secondaryAxis);
ColumnSeries series = new ColumnSeries()
{
ItemsSource = new ViewModel().Data,
XBindingPath = "XValue",
YBindingPath = "YValue",
Spacing = 0.5,
Width = 0.6,
};
chart.Series.Add(series);
this.Content = chart;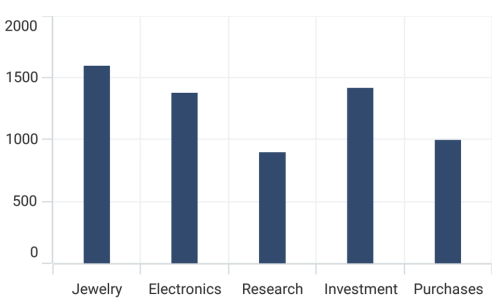
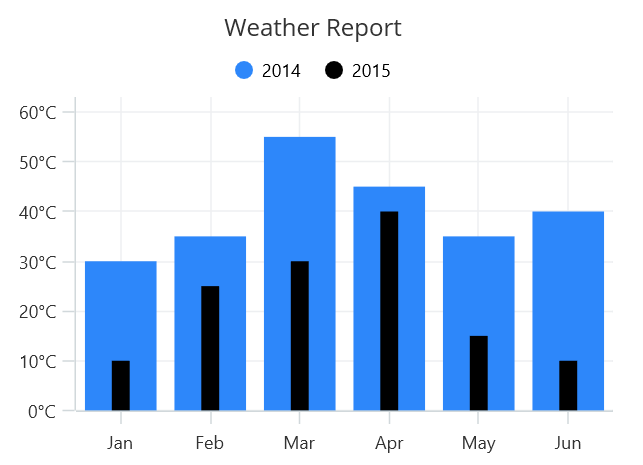
Overlapped series placement
By default, all column series that share the same x and y axes are placed side by side in a chart. To place the series one over the other (overlapped), set the EnableSideBySideSeriesPlacement property of SfCartesianChart to false and configure the Width property to differentiate the series. The following code sample and screenshot illustrate the overlapped placement of the column series.
<chart:SfCartesianChart EnableSideBySideSeriesPlacement="False">
    <chart:SfCartesianChart.XAxes>
        <chart:CategoryAxis/>
    </chart:SfCartesianChart.XAxes>

    <chart:SfCartesianChart.YAxes>
        <chart:NumericalAxis/>
    </chart:SfCartesianChart.YAxes>

    <chart:ColumnSeries ItemsSource="{Binding Data1}"
                        XBindingPath="XValue"
                        YBindingPath="YValue"/>

    <chart:ColumnSeries ItemsSource="{Binding Data2}"
                        XBindingPath="XValue"
                        YBindingPath="YValue"
                        Width="0.2"/>
</chart:SfCartesianChart>
SfCartesianChart chart = new SfCartesianChart();
chart.EnableSideBySideSeriesPlacement = false;
CategoryAxis primaryAxis = new CategoryAxis();
chart.XAxes.Add(primaryAxis);
NumericalAxis secondaryAxis = new NumericalAxis();
chart.YAxes.Add(secondaryAxis);
ColumnSeries series1 = new ColumnSeries()
{
ItemsSource = new ViewModel().Data1,
XBindingPath = "XValue",
YBindingPath = "YValue",
};
ColumnSeries series2 = new ColumnSeries()
{
ItemsSource = new ViewModel().Data2,
XBindingPath = "XValue",
YBindingPath = "YValue",
Width = 0.2,
};
chart.Series.Add(series1);
chart.Series.Add(series2);
this.Content = chart;