Range Column Chart in .NET MAUI Cartesian Chart
10 Jul 20264 minutes to read
Range Column Chart
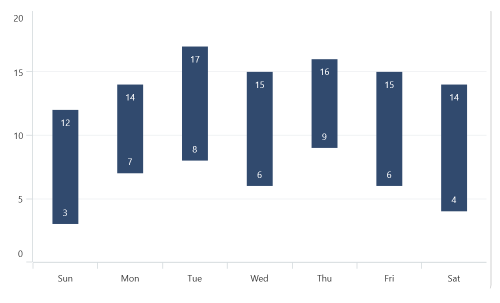
Range Column Chart is used to visualize data points with columns, with the height of each column representing the difference between the lowest and highest values of the data point.
NOTE
Prerequisite: Ensure that the required NuGet package is installed, the necessary namespaces are imported, and the SfCartesianChart control is properly configured in your application. For detailed setup and configuration instructions, refer to the Getting Started guide.
To render a range column chart, create an instance of RangeColumnSeries, and add it to the Series collection property of SfCartesianChart.
Since the RangeColumnSeries requires two Y values for each point, your data should contain both the high and low values. These high and low values specify the maximum and minimum ranges of the point.
NOTE
The Cartesian chart has Series as its default content.
<chart:SfCartesianChart>

    <chart:SfCartesianChart.XAxes>
        <chart:CategoryAxis/>
    </chart:SfCartesianChart.XAxes>

    <chart:SfCartesianChart.YAxes>
        <chart:NumericalAxis/>
    </chart:SfCartesianChart.YAxes>

    <chart:RangeColumnSeries ItemsSource="{Binding Data}"
                             XBindingPath="XValue"
                             High="HighValue"
                             Low="LowValue"/>

</chart:SfCartesianChart>
SfCartesianChart chart = new SfCartesianChart();
CategoryAxis primaryAxis = new CategoryAxis();
chart.XAxes.Add(primaryAxis);
NumericalAxis secondaryAxis = new NumericalAxis();
chart.YAxes.Add(secondaryAxis);
RangeColumnSeries series = new RangeColumnSeries()
{
ItemsSource = new ViewModel().Data,
XBindingPath = "XValue",
High = "HighValue",
Low = "LowValue",
};
chart.Series.Add(series);
this.Content = chart;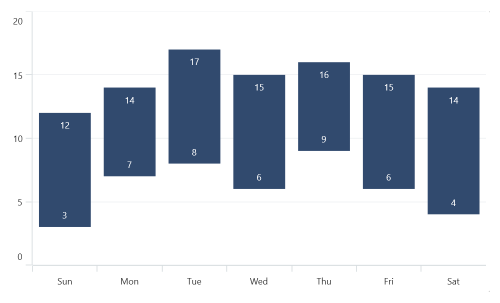
Spacing and Width
The Spacing property is used to change the spacing between two segments. The default value of spacing is 0, and the value ranges from 0 to 1. Here, 1 and 0 correspond to 100% and 0% of the available space, respectively.
The Width property is used to change the width of the segment. The default value of the width is 0.8, and the value ranges from 0 to 1.
<chart:SfCartesianChart>

    <chart:SfCartesianChart.XAxes>
        <chart:CategoryAxis/>
    </chart:SfCartesianChart.XAxes>

    <chart:SfCartesianChart.YAxes>
        <chart:NumericalAxis/>
    </chart:SfCartesianChart.YAxes>

    <chart:RangeColumnSeries ItemsSource="{Binding Data}"
                             XBindingPath="XValue"
                             High="HighValue"
                             Low="LowValue"
                             Spacing="0.3"
                             Width="0.7"/>
</chart:SfCartesianChart>
SfCartesianChart chart = new SfCartesianChart();
CategoryAxis primaryAxis = new CategoryAxis();
chart.XAxes.Add(primaryAxis);
NumericalAxis secondaryAxis = new NumericalAxis();
chart.YAxes.Add(secondaryAxis);
RangeColumnSeries series = new RangeColumnSeries()
{
ItemsSource = new ViewModel().Data,
XBindingPath = "XValue",
High = "HighValue",
Low = "LowValue",
Spacing = 0.3,
Width = 0.7,
};
chart.Series.Add(series);
this.Content = chart;