OHLC Chart in .NET MAUI Cartesian Chart
18 Nov 20188 minutes to read
OHLC (Open-High-Low-Close) charts are a type of financial chart used to represent the price movement of an asset over a specific period. OHLC charts display four price values: the opening price, the high price, the low price, and the closing price for each period. To render an OHLC chart, create an instance of HiLoOpenCloseSeries and add it to the Series collection property of the SfCartesianChart.
Prerequisite: Ensure that the required NuGet package is installed, the necessary namespaces are imported, and the SfCartesianChart control is properly configured in your application. For detailed setup and configuration instructions, refer to the Getting Started guide.
The Cartesian chart has Series as its default content.
A collection of five values is required to plot a point on an OHLC chart, including the X-value, open value, high value, low value, and close value. The binding properties are Open, High, Low, and Close, all of type string, which map to the corresponding properties in the data model. Use the following collection.
ObservableCollection<Model> StockData = new ObservableCollection<Model>();
StockData.Add(new Model { Year = "2000", High = 50, Low = 40, Open = 47, Close = 45 });
StockData.Add(new Model { Year = "2001", High = 50, Low = 35, Open = 45, Close = 40 });
StockData.Add(new Model { Year = "2002", High = 40, Low = 30, Open = 37, Close = 40 });
StockData.Add(new Model { Year = "2003", High = 50, Low = 35, Open = 40, Close = 45 });
StockData.Add(new Model { Year = "2004", High = 45, Low = 30, Open = 35, Close = 32 });
StockData.Add(new Model { Year = "2005", High = 50, Low = 35, Open = 40, Close = 45 });
StockData.Add(new Model { Year = "2006", High = 40, Low = 31, Open = 36, Close = 34 });
StockData.Add(new Model { Year = "2007", High = 48, Low = 38, Open = 43, Close = 40 });
StockData.Add(new Model { Year = "2008", High = 55, Low = 45, Open = 48, Close = 50 });
StockData.Add(new Model { Year = "2009", High = 45, Low = 30, Open = 35, Close = 40 });
StockData.Add(new Model { Year = "2010", High = 50, Low = 40, Open = 40, Close = 35 });
The following code shows how to render the OHLC chart in XAML and C#.
<chart:SfCartesianChart>
    <chart:SfCartesianChart.XAxes>
        <chart:CategoryAxis/>
    </chart:SfCartesianChart.XAxes>

    <chart:SfCartesianChart.YAxes>
        <chart:NumericalAxis/>
    </chart:SfCartesianChart.YAxes>

    <chart:HiLoOpenCloseSeries ItemsSource="{Binding StockData}"
                               XBindingPath="Year"
                               Open="Open"
                               High="High"
                               Low="Low"
                               Close="Close"/>
</chart:SfCartesianChart>
SfCartesianChart chart = new SfCartesianChart();
CategoryAxis primaryAxis = new CategoryAxis();
chart.XAxes.Add(primaryAxis);
NumericalAxis secondaryAxis = new NumericalAxis();
chart.YAxes.Add(secondaryAxis);
HiLoOpenCloseSeries series = new HiLoOpenCloseSeries()
{
ItemsSource = new ViewModel().StockData,
XBindingPath = "Year",
Open = "Open",
High = "High",
Low = "Low",
Close = "Close",
};
chart.Series.Add(series);
this.Content = chart;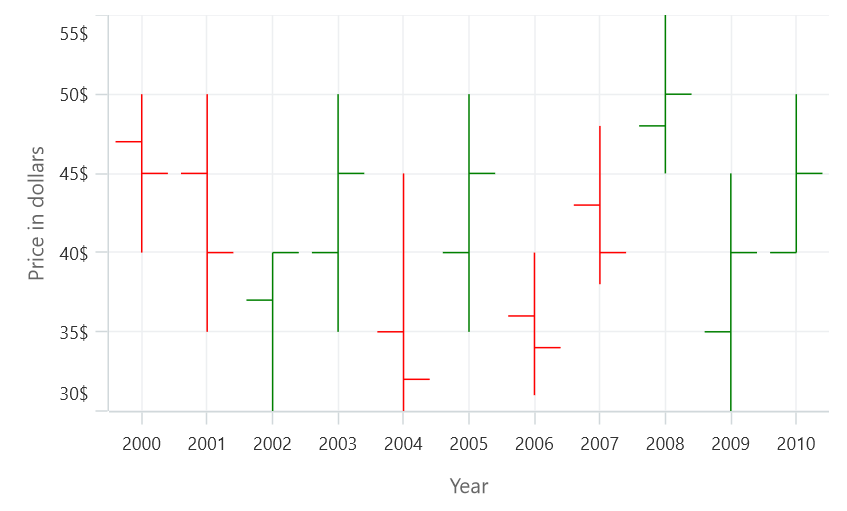
Bullish and bearish fill colors
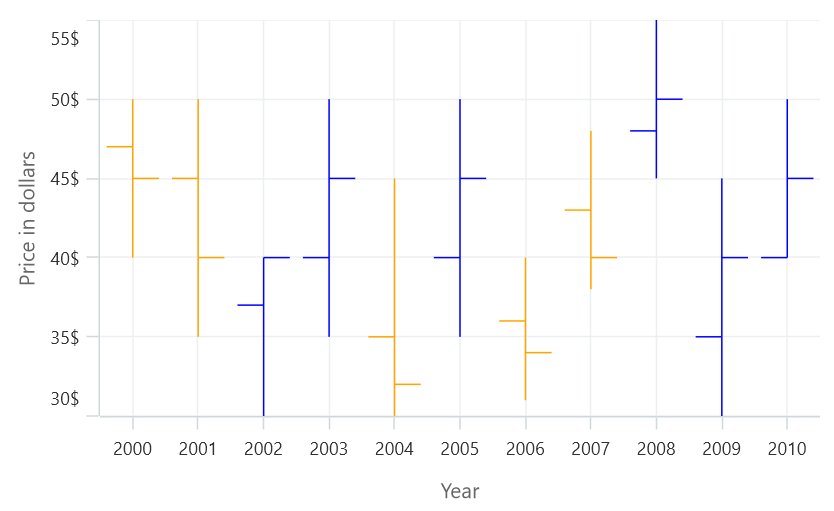
In the OHLC chart, the BullishFill property is used to specify a fill color for the segments that indicate an increase in the stock price in the measured time interval, and the BearishFill property is used to specify a fill color for the segments that indicate a decrease in the stock price in the measured time interval. By default, BullishFill is Colors.Green and BearishFill is Colors.Red.
<chart:SfCartesianChart>

    <chart:SfCartesianChart.XAxes>
        <chart:CategoryAxis/>
    </chart:SfCartesianChart.XAxes>

    <chart:SfCartesianChart.YAxes>
        <chart:NumericalAxis/>
    </chart:SfCartesianChart.YAxes>

    <chart:HiLoOpenCloseSeries ItemsSource="{Binding StockData}"
                               XBindingPath="Year"
                               Open="Open"
                               High="High"
                               Low="Low"
                               Close="Close"
                               BullishFill="Blue"
                               BearishFill="Orange"/>

</chart:SfCartesianChart>
SfCartesianChart chart = new SfCartesianChart();
CategoryAxis primaryAxis = new CategoryAxis();
chart.XAxes.Add(primaryAxis);
NumericalAxis secondaryAxis = new NumericalAxis();
chart.YAxes.Add(secondaryAxis);
HiLoOpenCloseSeries series = new HiLoOpenCloseSeries()
{
ItemsSource = new ViewModel().StockData,
XBindingPath = "Year",
Open = "Open",
High = "High",
Low = "Low",
Close = "Close",
BullishFill = Colors.Blue,
BearishFill = Colors.Orange,
};
chart.Series.Add(series);
this.Content = chart;