Spline Range Area Chart in .NET MAUI Chart
1 Jan 20259 minutes to read
Spline Range Area Chart
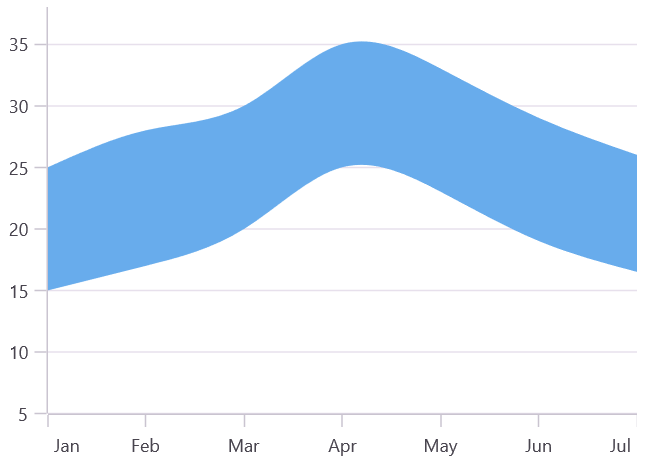
Spline Range Area Chart is used to visualize data points with smooth curves. In this series, the area between the curves is filled to indicate a range of values, such as a high and low price range or an upper and lower limit.
To render a spline range area chart, create an instance of SplineRangeAreaSeries and add it to the Series collection property of SfCartesianChart.
Since the SplineRangeAreaSeries requires two Y values for each point, your data should contain both the high and low values. These high and low values specify the maximum and minimum ranges of the point.
NOTE
The Cartesian chart has Series as its default content.
<chart:SfCartesianChart>

    <chart:SfCartesianChart.XAxes>
        <chart:CategoryAxis/>
    </chart:SfCartesianChart.XAxes>

    <chart:SfCartesianChart.YAxes>
        <chart:NumericalAxis/>
    </chart:SfCartesianChart.YAxes>

    <chart:SplineRangeAreaSeries ItemsSource="{Binding Data}"
                                 XBindingPath="XValue"
                                 High="HighValue"
                                 Low="LowValue"/>

</chart:SfCartesianChart>
SfCartesianChart chart = new SfCartesianChart();
CategoryAxis primaryAxis = new CategoryAxis();
chart.XAxes.Add(primaryAxis);
NumericalAxis secondaryAxis = new NumericalAxis();
chart.YAxes.Add(secondaryAxis);
SplineRangeAreaSeries series = new SplineRangeAreaSeries()
{
ItemsSource = new ViewModel().Data,
XBindingPath = "XValue",
High = "HighValue",
Low = "LowValue",
};
chart.Series.Add(series);
this.Content = chart;
Spline rendering types
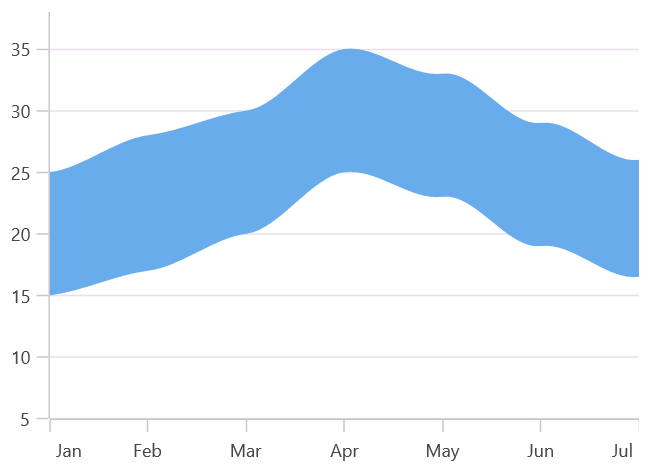
The Type property allows to change the rendering type of spline curve in series. The default value of Type is Natural.
The following types are used in SplineRangeAreaSeries:
NaturalMonotonicCardinalClamped
<chart:SfCartesianChart>

    <chart:SfCartesianChart.XAxes>
        <chart:CategoryAxis/>
    </chart:SfCartesianChart.XAxes>

    <chart:SfCartesianChart.YAxes>
        <chart:NumericalAxis/>
    </chart:SfCartesianChart.YAxes>

    <chart:SplineRangeAreaSeries ItemsSource="{Binding Data}"
                                 XBindingPath="XValue"
                                 High="HighValue"
                                 Low="LowValue"
                                 Type="Cardinal"/>

</chart:SfCartesianChart>
SfCartesianChart chart = new SfCartesianChart();
CategoryAxis primaryAxis = new CategoryAxis();
chart.XAxes.Add(primaryAxis);
NumericalAxis secondaryAxis = new NumericalAxis();
chart.YAxes.Add(secondaryAxis);
SplineRangeAreaSeries series = new SplineRangeAreaSeries()
{
ItemsSource = new ViewModel().Data,
XBindingPath = "XValue",
High = "HighValue",
Low = "LowValue",
Type = SplineType.Cardinal
};
chart.Series.Add(series);
this.Content = chart;
Enable Marker
A marker, also known as a symbol, is used to determine or highlight the position of the data point. To enable markers in the series, set the ShowMarkers property to true.
<chart:SfCartesianChart>
    ...
    <chart:SplineRangeAreaSeries ItemsSource="{Binding Data}"
                                 XBindingPath="XValue"
                                 High="HighValue"
                                 Low="LowValue"
                                 ShowMarkers="True"/>
</chart:SfCartesianChart>
SfCartesianChart chart = new SfCartesianChart();
...
SplineRangeAreaSeries series = new SplineRangeAreaSeries()
{
ItemsSource = new ViewModel().Data,
XBindingPath = "XValue",
High = "HighValue",
Low = "LowValue",
ShowMarkers= true,
};
chart.Series.Add(series);
this.Content= chart;Marker Customization
In order to change the series markers appearance, create an instance of the MarkerSettings property. The following properties are used to customize marker appearance.
-
Type, of type
ShapeType, describes the shape of the series marker. The default value of this property is the ShapeType.Circle. -
Stroke, of type
Brush, indicates the brush used to paint the marker border. -
StrokeWidth, of type
double, indicates the width of the marker border. -
Fill, of type
Brush, indicates the color of the marker. -
Width, of type
double, indicates the width of the marker. -
Height, of type
double, indicates the height of the marker.
<chart:SfCartesianChart>
    ...
    <chart:SplineRangeAreaSeries ItemsSource="{Binding Data}"
                                 XBindingPath="XValue"
                                 High="HighValue"
                                 Low="LowValue"
                                 ShowMarkers="True">
        <chart:SplineRangeAreaSeries.MarkerSettings>
            <chart:ChartMarkerSettings Type="Diamond"
                                       Fill="Brown"
                                       Stroke="Black"
                                       StrokeWidth="1"
                                       Height="8"
                                       Width="8"/>
        </chart:SplineRangeAreaSeries.MarkerSettings>
    </chart:SplineRangeAreaSeries>
</chart:SfCartesianChart>
SfCartesianChart chart = new SfCartesianChart();
...
ChartMarkerSettings chartMarker= new ChartMarkerSettings()
{
Type = ShapeType.Diamond,
Fill = Colors.Brown,
Stroke = Colors.Black,
StrokeWidth = 1,
Height = 8,
Width = 8
};
SplineRangeAreaSeries series = new SplineRangeAreaSeries()
{
XBindingPath = "XValue",
High = "HighValue",
Low = "LowValue",
ItemsSource = new ViewModel().Data,
ShowMarkers = true,
MarkerSettings = chartMarker,
};
chart.Series.Add(series);
this.Content = chart;