Range in WPF Charts (SfChart)
8 Jul 20266 minutes to read
HiLo Chart
In HiLoSeries, each segment is represented by a line. The height of the line depends on the value of the data point, high or low. The values for this series can be bind using High and Low.
The following code example shows the use of HiLo series:
<chart:HiLoSeries
    Name="series"
    Interior="#4A4A4A"
    ItemsSource="{Binding StockPriceDetails}"
    XBindingPath="Date"
    StrokeThickness="3"
    High="High"
    Low="Low"/>
HiLoSeries series = new HiLoSeries()
{
ItemsSource = new ViewModel().StockPriceDetails,
XBindingPath = "Date",
High = "High",
Low = "Low",
StrokeThickness = 3,
Interior = new SolidColorBrush(Color.FromRgb(0x4A, 0x4A, 0X4A))
};
chart.Series.Add(series);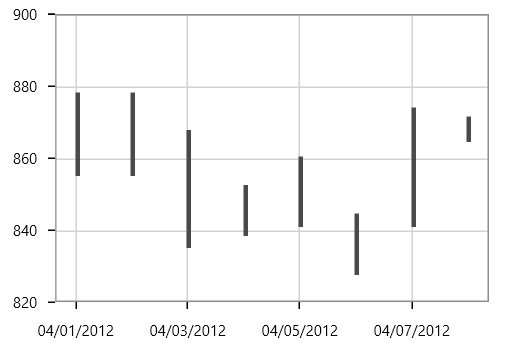
NOTE
You can explore our WPF HiLo Chart feature tour page for its groundbreaking features. You can also explore our WPF HiLo Chart example to know how to represent time-dependent data, showing trends in data at equal intervals.
Range Column Chart
RangeColumnSeries is a collection of vertical columns where positioning and height depends on the high and low values of each data point. RangeColumnSeries is used when minimum and maximum need to be specified for the ColumnSeries.
<chart:RangeColumnSeries
    ItemsSource="{Binding FinancialDatas}"
    XBindingPath="Time"
    Interior="#4A4A4A"
    High="High"
    Low="Low"/>
RangeColumnSeries series = new RangeColumnSeries()
{
ItemsSource = new ViewModel().FinancialDatas,
XBindingPath = "Time",
High = "High",
Low = "Low",
Interior = new SolidColorBrush(Color.FromRgb(0x4A, 0x4A, 0x4A))
};
chart.Series.Add(series);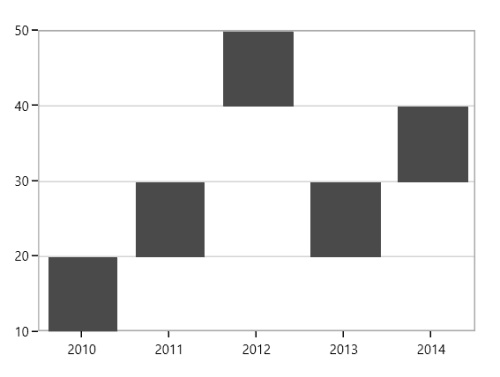
NOTE
You can explore our WPF Range Column Chart feature tour page for its groundbreaking features. You can also explore our WPF Range Column Chart example to know how to display multiple series of data as range column.
Range Area Chart
RangeAreaSeries is used to display continuous data points as a set of lines that vary between High and Low values over intervals of time and across different categories.
<chart:RangeAreaSeries
    ItemsSource="{Binding Products}"
    XBindingPath="ProdName"
    High="Stock"
    Low="Price"
    Interior="#BCBCBC"/>
RangeAreaSeries series = new RangeAreaSeries()
{
ItemsSource = new ViewModel().Products,
XBindingPath = "ProdName",
High = "Stock",
Low = "Price",
Interior = new SolidColorBrush(Color.FromRgb(0xBC, 0xBC, 0xBC))
};
chart.Series.Add(series);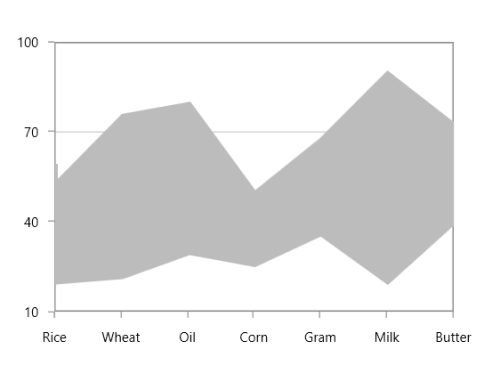
The APIs present in the RangeArea series are,
-
HighValueInterior-Gets or sets the brush that represents the interior color for the high value data. -
LowValueInterior- Gets or sets the brush that represents the interior color for the low value data.
<chart:RangeAreaSeries
    x:Name="RangeAreaSeries"
    XBindingPath="ProdName"
    High="Stock"
    Low="Price"
    LowValueInterior="#4A4A4A"
    HighValueInterior="#777777"
    ItemsSource="{Binding Products}"/>
RangeAreaSeries series = new RangeAreaSeries()
{
ItemsSource = new ViewModel().Products,
XBindingPath = "ProdName",
High = "Stock",
Low = "Price",
HighValueInterior = new SolidColorBrush(Color.FromRgb(0x77, 0x77, 0x77)),
LowValueInterior = new SolidColorBrush(Color.FromRgb(0x4A, 0x4A, 0x4A))
};
chart.Series.Add(series);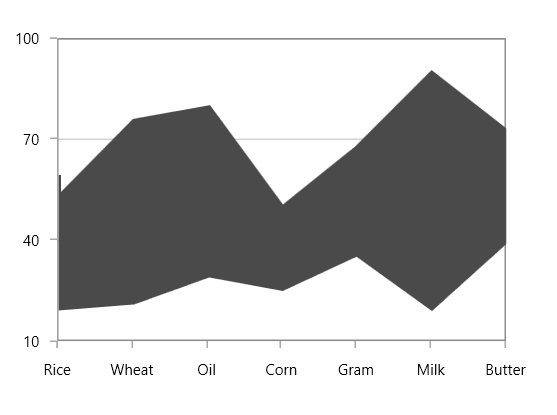
NOTE
You can explore our WPF Range Area Chart feature tour page for its groundbreaking features. You can also explore our WPF Range Area Chart example to know how to display multiple series of data as range area.
Spline Range Area Chart
SplineRangeAreaSeries is used to display continuous data points as smooth Bezier curves that vary between High and Low values over intervals of time and across different categories.
<chart:SplineRangeAreaSeries
    ItemsSource = "{Binding Products}"
    XBindingPath="ProdName"
    High="Stock"
    Low="Price"
    Interior="#BCBCBC"/>
SplineRangeAreaSeries splineRangeAreaSeries = new SplineRangeAreaSeries();
splineRangeAreaSeries.ItemsSource = new ViewModel().Products;
splineRangeAreaSeries.XBindingPath = "ProdName";
splineRangeAreaSeries.High = "Stock";
splineRangeAreaSeries.Low = "Price";
splineRangeAreaSeries.Interior = new SolidColorBrush(Color.FromRgb(0xBC, 0xBC, 0xBC));
chart.Series.Add(splineRangeAreaSeries);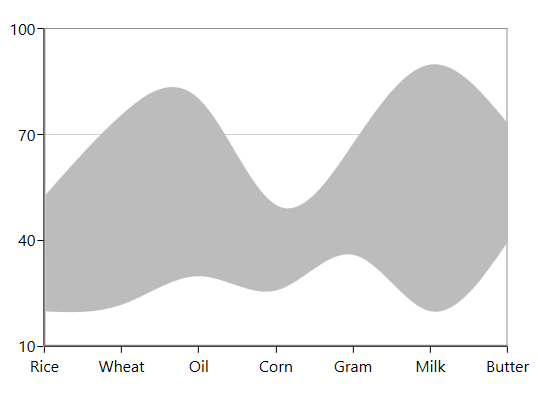
NOTE
You can explore our WPF Spline Range Area Chart feature tour page for its groundbreaking features. You can also explore our WPF Spline Range Area Chart example to know how to display multiple series of data as spline range area.