Bubble and Scatter in WPF Charts (SfChart)
8 Jul 20263 minutes to read
Bubble Chart
BubbleSeries is represented by closely packed circles, whose areas are proportional to the quantities.
The size of the bubble series is relative proportional to the value bind with the series using Size property. You can set the constraints on this size using MinimumRadius and MaximumRadius.
<chart:BubbleSeries
    ItemsSource="{Binding Fruits}"
    XBindingPath="FruitName"
    YBindingPath="People"
    Size="Size"
    MinimumRadius="5"
    MaximumRadius="10"
    Interior="#BCBCBC">
</chart:BubbleSeries>
BubbleSeries series = new BubbleSeries()
{
ItemsSource = new ViewModel().Fruits,
XBindingPath = "FruitName",
YBindingPath = "People",
Size = "Size",
MinimumRadius = 5,
Interior = new SolidColorBrush(Color.FromRgb(0x4A, 0x4A, 0x4A))
};
chart.Series.Add(series);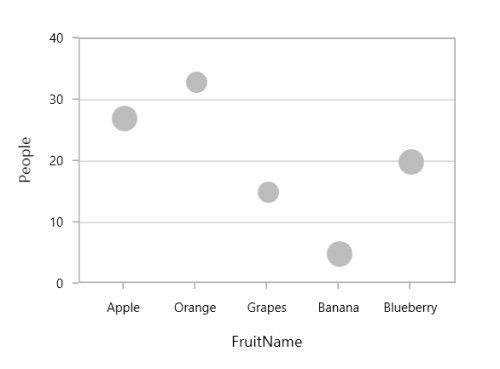
NOTE
You can refer to our WPF Bubble Chart feature tour page for its groundbreaking feature representations. You can also explore our WPF Bubble Chart example to know how to render and configure the bubble chart.
Show Zero Bubbles
The zero size bubble segments can be enabled or disabled by using the ShowZeroBubbles property. By default, the property value is True.
The following code illustrates how to set the value to the property.
<chart:BubbleSeries ShowZeroBubbles="True"></chart:BubbleSeries>BubbleSeries series = new BubbleSeries();
series.ShowZeroBubbles = true;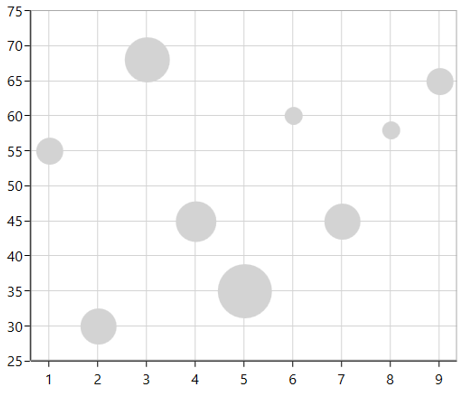
The following code example and screenshots describes when ShowZeroBubbles value is false.
<chart:BubbleSeries ShowZeroBubbles="False"></chart:BubbleSeries>BubbleSeries series = new BubbleSeries();
series.ShowZeroBubbles = false;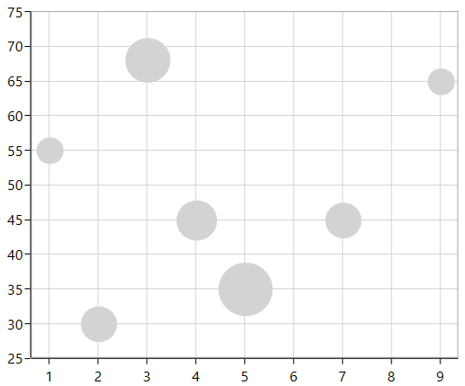
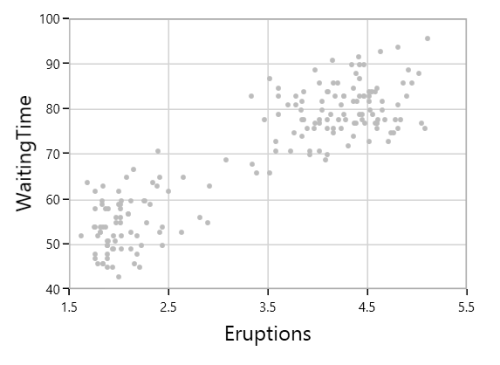
Scatter Chart
ScatterSeries is similar to bubble series when each point being represented by an ellipse with equal size. This size can be defined by using ScatterHeight and ScatterWidth properties.
<chart:ScatterSeries
    Interior="#4A4A4A"
    ScatterHeight="4"
    ScatterWidth="4"
    ItemsSource="{Binding data points}"
    XBindingPath="Eruptions"
    YBindingPath="WaitingTime">
</chart:ScatterSeries>
ScatterSeries series = new ScatterSeries()
{
ItemsSource = new ViewModel().data points,
XBindingPath = "Eruptions",
YBindingPath = "WaitingTime",
ScatterHeight = 4,
ScatterWidth = 4,
Interior = new SolidColorBrush(Color.FromRgb(0x4A, 0x4A, 0x4A))
};
chart.Series.Add(series);