Getting Started with WPF Charts
18 Nov 201824 minutes to read
This section explains the steps required to populate the chart with data, header, data labels, legend, and tooltips in the chart. This section covers only the minimal features that you need to learn to get started with the chart.
To get started quickly with WPF Chart, you can check this video:
Adding chart reference
Refer to this article to learn how to add Syncfusion® controls to Visual Studio projects in various ways. You can also refer to this link to learn about the assemblies required for adding Chart to your project.
Initialize chart
Import the WPF Chart (SfChart) namespace as follows in your respective Window.
xmlns:syncfusion="clr-namespace:Syncfusion.UI.Xaml.Charts;assembly=Syncfusion.SfChart.WPF"using Syncfusion.UI.Xaml.Charts;Imports Syncfusion.UI.Xaml.ChartsThen initialize an empty chart with two axes as shown below.
<syncfusion:SfChart>
      <syncfusion:SfChart.PrimaryAxis>
           <syncfusion:CategoryAxis/>
      </syncfusion:SfChart.PrimaryAxis>
      <syncfusion:SfChart.SecondaryAxis>
           <syncfusion:NumericalAxis/>
      </syncfusion:SfChart.SecondaryAxis>
 </syncfusion:SfChart>
SfChart chart = new SfChart();
CategoryAxis primaryAxis = new CategoryAxis();
chart.PrimaryAxis = primaryAxis;
NumericalAxis secondaryAxis = new NumericalAxis();
chart.SecondaryAxis = secondaryAxis;Dim chart As New SfChart()
Dim primaryAxis As New CategoryAxis ()
chart.PrimaryAxis = primaryAxis
Dim secondaryAxis As New NumericalAxis ()
chart.SecondaryAxis = secondaryAxisRun the project and check if you get the following output to make sure you have configured your project properly to add SfChart.
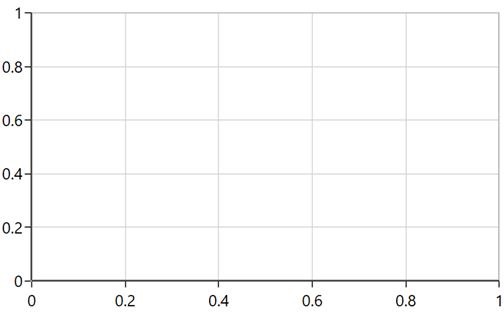
SfChartsupports default axes, so these axes (PrimaryAxisandSecondaryAxis) will be generated automatically based upon the data bound to the chart if you didn’t specify the axes explicitly.
Initialize view model
Now, let us define a simple data model that represents a data point in the WPF Chart (SfChart).
public class Person
{
    public string Name { get; set; }
    public double Height { get; set; }
}
Public Class Person
Public Property Name As String
Public Property Height As Double
End ClassNext, create a view model class and initialize a list of Person objects as follows.
public class ViewModel
{
    public List<Person> Data { get; set; }

    public ViewModel()
    {
        Data = new List<Person>()
        {
            new Person { Name = "David", Height = 180 },
            new Person { Name = "Michael", Height = 170 },
            new Person { Name = "Steve", Height = 160 },
            new Person { Name = "Joel", Height = 182 }
        };
    }
}
Public Class ViewModel
Public Property Data As List(Of Person)
Public Sub New()
Data = New List(Of Person)() From
{
New Person With {.Name = "David", .Height = 180},
New Person With {.Name = "Michael", .Height = 170},
New Person With {.Name = "Steve", .Height = 160},
New Person With {.Name = "Joel", .Height = 182}
}
End Sub
End ClassSet the ViewModel instance as the DataContext of your window; this is done to bind properties of ViewModel to SfChart.
Add namespace of
ViewModelclass to your XAML window if you prefer to setDataContextin XAML.
<Window x:Class=" ChartDemo.MainWindow"
        xmlns="http://schemas.microsoft.com/winfx/2006/xaml/presentation"
        xmlns:x="http://schemas.microsoft.com/winfx/2006/xaml"
        xmlns:d="http://schemas.microsoft.com/expression/blend/2008"
        xmlns:mc="http://schemas.openxmlformats.org/markup-compatibility/2006"
        xmlns:local="clr-namespace:ChartDemo "
        xmlns:syncfusion ="clr-namespace:Syncfusion.UI.Xaml.Charts;assembly=Syncfusion.SfChart.WPF"
        mc:Ignorable="d"
        Title="MainWindow" Height="350" Width="525">

    <Window.DataContext>
        <local:ViewModel/>
    </Window.DataContext>
</Window>this.DataContext = new ViewModel();Me.DataContext = New ViewModel()Populate chart with data
As we are going to visualize the comparison of heights in the data model, add ColumnSeries to the SfChart.Series property, and then bind the Data property of the above ViewModel to the ColumnSeries.ItemsSource property as follows.
You need to set
XBindingPathandYBindingPathproperties, so thatSfChartfetches values from the respective properties in the data model to plot the series.
<syncfusion:SfChart>
    <syncfusion:SfChart.PrimaryAxis>
        <syncfusion:CategoryAxis Header="Name"/>
    </syncfusion:SfChart.PrimaryAxis>

    <syncfusion:SfChart.SecondaryAxis>
        <syncfusion:NumericalAxis Header="Height(in cm)"/>
    </syncfusion:SfChart.SecondaryAxis>

    <syncfusion:ColumnSeries  ItemsSource="{Binding Data}" XBindingPath="Name" YBindingPath="Height">
    </syncfusion:ColumnSeries>
</syncfusion:SfChart>
SfChart chart = new SfChart();
//Adding horizontal axis to the chart
CategoryAxis primaryAxis = new CategoryAxis();
primaryAxis.Header = "Name";
chart.PrimaryAxis = primaryAxis;
//Adding vertical axis to the chart
NumericalAxis secondaryAxis = new NumericalAxis();
secondaryAxis.Header = "Height(in cm)";
chart.SecondaryAxis = secondaryAxis;
//Initialize the two series for SfChart
ColumnSeries series = new ColumnSeries();
series.ItemsSource = (new ViewModel()).Data;
series.XBindingPath = "Name";
series.YBindingPath = "Height";
//Adding Series to the Chart Series Collection
chart.Series.Add(series);Dim chart As New SfChart()
'Adding horizontal axis to the chart
Dim primaryAxis As New CategoryAxis()
primaryAxis.Header = "Name"
chart.PrimaryAxis = primaryAxis
'Adding vertical axis to the chart
Dim secondaryAxis As New NumericalAxis()
secondaryAxis.Header = "Height(in cm)"
chart.SecondaryAxis = secondaryAxis
'Initialize the two series for SfChart
Dim series As New ColumnSeries()
series.ItemsSource = New ViewModel().Demands
series.XBindingPath = "Name"
series.YBindingPath = "Height"
'Adding Series to the Chart Series Collection
chart.Series.Add(series)Syncfusion® Chart also supports rendering a combination of multiple series. Refer to
thisfor details.
Add title
The header of the chart acts as the title to provide quick information to the user about the data being plotted in the chart. You can set the title using the Header property of the chart as follows.
<Grid>
   <syncfusion:SfChart Header="Chart">
   </syncfusion:SfChart>
</Grid>chart.Header = "Chart";Dim chart As New SfChart()
chart.Header = "Chart"Refer to this link to learn more about the options available in SfChart to customize chart header.
Enable data labels
You can add data labels to improve the readability of the chart, and it can be enabled using the AdornmentInfo property of ChartSeries. By default, no label is displayed; you have to set the ShowLabel property of ChartAdornmentInfo to true.
<syncfusion:SfChart>
<!-- code omitted for brevity -->
<syncfusion:ColumnSeries>
<syncfusion:ColumnSeries.AdornmentsInfo>
<syncfusion:ChartAdornmentInfo ShowLabel="True"/>
</syncfusion:ColumnSeries.AdornmentsInfo>
</syncfusion:ColumnSeries>
<!-- code omitted for brevity -->
</syncfusion:SfChart>series.AdornmentsInfo = new ChartAdornmentInfo(){ ShowLabel = true };series.AdornmentsInfo = New ChartAdornmentInfo() With { ShowLabel = True}Refer to this link to learn more about the options available in SfChart to customize chart adornments.
Enable legend
You can enable legend using the SfChart.Legend property as follows.
<syncfusion:SfChart>
<!-- code omitted for brevity -->
<syncfusion:SfChart.Legend>
<syncfusion:ChartLegend/>
</syncfusion:SfChart.Legend>
<!-- code omitted for brevity -->
</syncfusion:SfChart>chart.Legend = new ChartLegend();chart.Legend = New ChartLegend()Additionally, you need to set a label for each series using the Label property of ChartSeries, which will be displayed in the corresponding legend.
<syncfusion:SfChart>
<!-- code omitted for brevity -->
<syncfusion:ColumnSeries
Label="Heights"
ItemsSource="{Binding Data}"
XBindingPath="Name"
YBindingPath="Height"/>
<!-- code omitted for brevity -->
</syncfusion:SfChart>ColumnSeries series = new ColumnSeries();
series.ItemsSource = (new ViewModel()).Data;
series.XBindingPath = "Name";
series.YBindingPath = "Height";
series.Label = "Heights";Dim series As New ColumnSeries()
series.ItemsSource = New ViewModel().Data
series.XBindingPath = "Name"
series.YBindingPath = "Height"
series.Label = "Heights"Refer to this link to learn more about the options available in SfChart to customize legend.
Enable tooltip
Tooltips are used to show information about the segment when you click the segment. You can enable tooltips by setting the series ShowTooltip property to true.
<syncfusion:SfChart>
<!-- code omitted for brevity -->
<syncfusion:ColumnSeries
ShowTooltip="True"
ItemsSource="{Binding Data}"
XBindingPath="Name"
YBindingPath="Height"/>
<!-- code omitted for brevity -->
</syncfusion:SfChart>ColumnSeries series = new ColumnSeries();
series.ItemsSource = (new ViewModel()).Data;
series.XBindingPath = "Name";
series.YBindingPath = "Height";
series.ShowTooltip = true;Dim series As New ColumnSeries ()
series.ItemsSource = New ViewModel().Data
series.XBindingPath = "Name"
series.YBindingPath = "Height"
series.ShowTooltip = TrueRefer to this link to learn more about the options available in SfChart to customize tooltip.
The following code example gives you the complete code of above configurations.
<Window x:Class="Sample_WPF.MainWindow"
xmlns="http://schemas.microsoft.com/winfx/2006/xaml/presentation"
xmlns:x="http://schemas.microsoft.com/winfx/2006/xaml"
xmlns:d="http://schemas.microsoft.com/expression/blend/2008"
xmlns:mc="http://schemas.openxmlformats.org/markup-compatibility/2006"
xmlns:local="clr-namespace:Sample_WPF"
xmlns:syncfusion="clr-namespace:Syncfusion.UI.Xaml.Charts;assembly=Syncfusion.SfChart.WPF"
mc:Ignorable="d"
Title="MainWindow" Height="350" Width="525">
<!--Setting DataContext for SfChart-->
<Window.DataContext>
<local:ViewModel/>
</Window.DataContext>
<Grid>
<syncfusion:SfChart Header="Chart" Height="300" Width="500">
<!--Initialize the horizontal axis for SfChart-->
<syncfusion:SfChart.PrimaryAxis>
<syncfusion:CategoryAxis Header="Name" FontSize="14"/>
</syncfusion:SfChart.PrimaryAxis>
<!--Initialize the vertical axis for SfChart-->
<syncfusion:SfChart.SecondaryAxis>
<syncfusion:NumericalAxis Header="Height(in cm)" FontSize="14"/>
</syncfusion:SfChart.SecondaryAxis>
<!--Adding Legend to the SfChart-->
<syncfusion:SfChart.Legend>
<syncfusion:ChartLegend/>
</syncfusion:SfChart.Legend>
<!--Initialize the series for SfChart-->
<syncfusion:ColumnSeries Label="Heights" ItemsSource="{Binding Data}" XBindingPath="Name" YBindingPath="Height" ShowTooltip="True">
<syncfusion:ColumnSeries.AdornmentsInfo>
<syncfusion:ChartAdornmentInfo ShowLabel="True">
</syncfusion:ChartAdornmentInfo>
</syncfusion:ColumnSeries.AdornmentsInfo>
</syncfusion:ColumnSeries>
</syncfusion:SfChart>
</Grid>
</Window>using Syncfusion.UI.Xaml.Charts;
namespace ChartDemo
{
public sealed partial class MainWindow : Window
{
public MainWindow()
{
InitializeComponent();
SfChart chart = new SfChart() { Header = "Chart", Height = 300, Width = 500 };
//Adding horizontal axis to the chart
CategoryAxis primaryAxis = new CategoryAxis();
primaryAxis.Header = "Name";
primaryAxis.FontSize = 14;
chart.PrimaryAxis = primaryAxis;
//Adding vertical axis to the chart
NumericalAxis secondaryAxis = new NumericalAxis();
secondaryAxis.Header = "Height(in cm)";
secondaryAxis.FontSize = 14;
chart.SecondaryAxis = secondaryAxis;
//Adding Legends for the chart
ChartLegend legend = new ChartLegend();
chart.Legend = legend;
//Initializing column series
ColumnSeries series = new ColumnSeries();
series.ItemsSource = (new ViewModel()).Data;
series.XBindingPath = "Name";
series.YBindingPath = "Height";
series.ShowTooltip = true;
series.Label = "Heights";
//Setting adornment to the chart series
series.AdornmentsInfo = new ChartAdornmentInfo() { ShowLabel = true };
//Adding Series to the Chart Series Collection
chart.Series.Add(series);
this.Content = chart;
}
}
}Imports Syncfusion.UI.Xaml.Charts
Partial Public Class MainWindow
Inherits Window
Public Sub New()
InitializeComponent()
Dim chart As New SfChart()

chart.Header = "Chart"
chart.Height = 300
chart.Width = 500
'Adding horizontal axis to the chart
Dim primaryAxis As New CategoryAxis()
primaryAxis.Header = "Name"
primaryAxis.FontSize = 14
chart.PrimaryAxis = primaryAxis
'Adding vertical axis to the chart
Dim secondaryAxis As New NumericalAxis()
secondaryAxis.Header = "Height(in cm)"
secondaryAxis.FontSize = 14
chart.SecondaryAxis = secondaryAxis
'Adding Legends for the chart
Dim legend As New ChartLegend()
chart.Legend = legend
'Initializing column series
Dim series As New ColumnSeries()
series.ItemsSource = New ViewModel().Data
series.XBindingPath = "Name"
series.YBindingPath = "Height"
series.Label = "Heights"
series.ShowTooltip = True
'Setting adornment to the chart series
series.AdornmentsInfo = New ChartAdornmentInfo() With {.ShowLabel = True}
'Adding Series to the Chart Series Collection
chart.Series.Add(series)
Me.Content = chart
End Sub
End ClassThe following chart is created as a result of the previous codes.
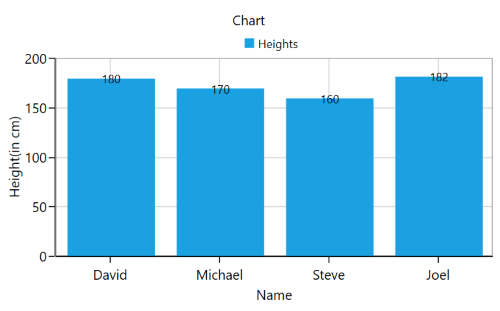
You can find the complete getting started sample from this link.
You can refer to our WPF Charts feature tour page for its groundbreaking feature representations. You can also explore our WPF Charts example to know various chart types and how to easily configure them with built-in support for creating stunning visual effects.
See also
How to create a chart control in WPF application using XAMLHow to create a Chart control example in C# WPFHow to create chart control example in VB .NET WPFHow to create Chart in F# WPF-
How to Handle Multiple Series in WPF Chart Using MVVM Pattern
How to display the chart area alone in Chart?
How to redraw the chart while dragging the series out of the range?
How to create a real time Chart using MVVM in WPF?
How to add watermark to chart?
Theme
WPF Charts supports various built-in themes. Refer to the below links to apply themes,