Data Markers in WPF Charts (SfChart)
8 Jul 20261 minute to read
Chart adornments (Data Markers) are used to display values related to a chart segment element. Values from a data point (X, Y) or other custom properties from a data source can be displayed.
Each adornment can be represented by the following:
- Label - Displays the segment label content at the (X, Y) point.
- Marker - Displays the desired symbol at the (X, Y) point.
- ConnectorLine - Line used to connect the (X, Y) point and the label element.
The following code example illustrates how to initialize the adornment.
<syncfusion:ColumnSeries
    Interior="#777777"
    ItemsSource="{Binding Demands}"
    XBindingPath="Category"
    YBindingPath="Value">

    <syncfusion:ColumnSeries.AdornmentsInfo>
        <syncfusion:ChartAdornmentInfo/>
    </syncfusion:ColumnSeries.AdornmentsInfo>
</syncfusion:ColumnSeries>
ColumnSeries series = new ColumnSeries()
{
ItemsSource = ViewModel().Demands,
XBindingPath = "Category",
YBindingPath = "Value",
Interior = new SolidColorBrush(Color.FromRgb(0x77, 0x77, 0x77))
};
ChartAdornmentInfo adornmentInfo = new ChartAdornmentInfo();
series.AdornmentsInfo = adornmentInfo;
chart.Series.Add(series);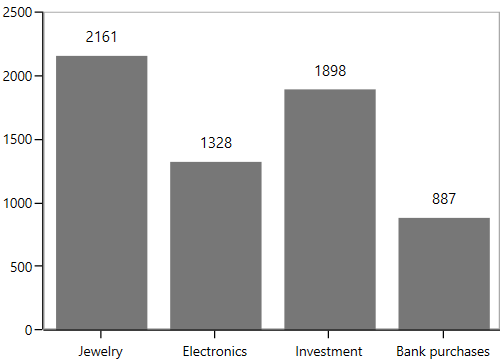
See also
How to show different data marker based on the value in the WPF Chart?
How to show custom data marker in the WPF Chart?
How to rotate text in adornment?
How to display the labels inside segments?
How to bind the underlying DataTable model to the DataMarker Template in WPF Charts?