Technical Indicators in WPF Charts (SfChart)
8 Jul 202619 minutes to read
Technical indicators are the base of technical analysis, which are used to determine the future market trends.
Adding Technical Indicators to the Chart
Technical indicator merely an another type meta series. The following steps illustrates how to add the technical indicators to the chart:
Initializing Indicator
Create the instance for any technical indicator and add it to the TechnicalIndicators collection.
Here for instance, the Accumulation Distribution is added.
<chart:SfChart.TechnicalIndicators>
    <chart:AccumulationDistributionIndicator/>
</chart:SfChart.TechnicalIndicators>
AccumulationDistributionIndicator indicator = new AccumulationDistributionIndicator();
chart.TechnicalIndicators.Add(indicator);Binding the Data
Next you need to bind the property path for the Open, High, Low and Close along with x value binding property.
<chart:SfChart.TechnicalIndicators>
    <chart:AccumulationDistributionIndicator
        Open="Open"
        Close="Close"
        High="High"
        Low="Low">
    </chart:AccumulationDistributionIndicator>
</chart:SfChart.TechnicalIndicators>
AccumulationDistributionIndicator indicator = new AccumulationDistributionIndicator()
{
Open = "Open",
Close = "Close",
High = "High",
Low = "Low"
};
chart.TechnicalIndicators.Add(indicator);Specifying the ItemsSource
<chart:SfChart.TechnicalIndicators>
    <chart:AccumulationDistributionIndicator
        ItemsSource="{Binding StockPriceDetails}"
        XBindingPath="Date"
        Open="Open"
        Close="Close"
        High="High"
        Low="Low">
    </chart:AccumulationDistributionIndicator>
</chart:SfChart.TechnicalIndicators>
AccumulationDistributionIndicator indicator = new AccumulationDistributionIndicator()
{
ItemsSource = new ViewModel().StockPriceDetails,
XBindingPath = "Date",
Open = "Open",
Close = "Close",
High = "High",
Low = "Low"
};
chart.TechnicalIndicators.Add(indicator);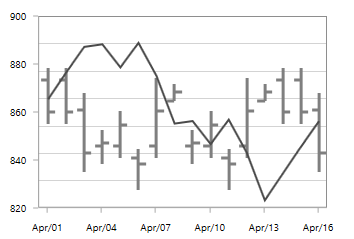
The following sections covers all the different types of technical indicators available in SfChart.
Most of the indicators are having the Period and SignalLineColor properties as common, in which Period property indicates the moving average period and the SignalLineColor defines the color for the respective indicator line.
Average True Range
You can define the AverageTrueRangeIndicator using the following code example
<chart:SfChart.TechnicalIndicators>
    <chart:AverageTrueRangeIndicator
        ItemsSource="{Binding StockPriceDetails}"
        Period="3"
        XBindingPath="Date"
        Volume="Volume"
        SignalLineColor="Black"
        High="High"
        Low="Low"
        Open="Open"
        Close="Close"/>
</chart:SfChart.TechnicalIndicators>
AverageTrueRangeIndicator indicator = new AverageTrueRangeIndicator()
{
ItemsSource = new ViewModel().StockPriceDetails,
XBindingPath = "Date",
Open = "Open",
Close = "Close",
High = "High",
Low = "Low",
Volume ="Volume",
Period = 3,
SignalLineColor = new SolidColorBrush(Colors.Black)
};
chart.TechnicalIndicators.Add(indicator);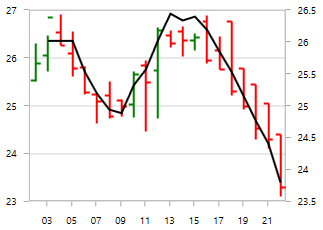
Simple Average
The following code example demonstrates the usage of SimpleAverageIndicator.
<chart:SfChart.TechnicalIndicators>
    <chart:SimpleAverageIndicator
        ItemsSource="{Binding ViewModel1}"
        Period="3"
        SignalLineColor="Black"
        XBindingPath="Date"
        Volume="Volume"
        High="High"
        Low="Low"
        Open="Open"
        Close="Close">
    </chart:SimpleAverageIndicator>
</chart:SfChart.TechnicalIndicators>
SimpleAverageIndicator indicator = new SimpleAverageIndicator()
{
ItemsSource = new ViewModel().ViewModel1,
XBindingPath = "Date",
Open = "Open",
Close = "Close",
High = "High",
Low = "Low",
Volume = "Volume",
Period = 3,
SignalLineColor = new SolidColorBrush(Colors.Black)
};
chart.TechnicalIndicators.Add(indicator);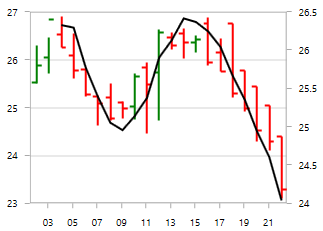
RSI
The Relative Strength Index(RSI) indicators are having additional two lines other than signal line, which indicate the overbought and oversold region.
The UpperLineColor property is used to define the color for the line indicating overbought region and the LowerLineColor property is used to define the color for the line indicating oversold region.
To define the RSITechnicalIndicator, you can use the following code example:
<chart:SfChart.TechnicalIndicators>
    <chart:RSITechnicalIndicator
        ItemsSource="{Binding StockPriceDetails}"
        Period="3"
        SignalLineColor="Black"
        XBindingPath="Date"
        Volume="Volume"
        UpperLineColor="Blue"
        LowerLineColor="Red"
        High="High"
        Low="Low"
        Open="Open"
        Close="Close"/>
</chart:SfChart.TechnicalIndicators>
RSITechnicalIndicator indicator = new RSITechnicalIndicator()
{
ItemsSource = new ViewModel().StockPriceDetails,
XBindingPath = "Date",
Open = "Open",
Close = "Close",
High = "High",
Low = "Low",
Volume = "Volume",
Period = 3,
SignalLineColor = new SolidColorBrush(Colors.Black),
UpperLineColor = new SolidColorBrush(Colors.Blue),
LowerLineColor = new SolidColorBrush(Colors.Red)
};
chart.TechnicalIndicators.Add(indicator);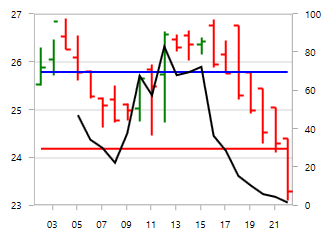
Momentum
This indicator is having two lines momentum line and center line. No signal line is in this indicator. You can define momentum technical indicator using the following code example.
The MomentumLineColor property and CenterLineColor property are used to define the color for the momentum and center line respectively.
<chart:SfChart.TechnicalIndicators>
    <chart:MomentumTechnicalIndicator
        ItemsSource="{Binding ViewModel1}"
        Period="3"
        CenterLineColor="Blue"
        XBindingPath="Date"
        Volume="Volume"
        MomentumLineColor="Black"
        High="High"
        Low="Low"
        Open="Open"
        Close="Close"/>
</chart:SfChart.TechnicalIndicators>
MomentumTechnicalIndicator indicator = new MomentumTechnicalIndicator()
{
ItemsSource = new ViewModel().ViewModel1,
XBindingPath = "Date",
Open = "Open",
Close = "Close",
High = "High",
Low = "Low",
Volume = "Volume",
Period = 3,
MomentumLineColor = new SolidColorBrush(Colors.Black),
CenterLineColor = new SolidColorBrush(Colors.Red)
};
chart.TechnicalIndicators.Add(indicator);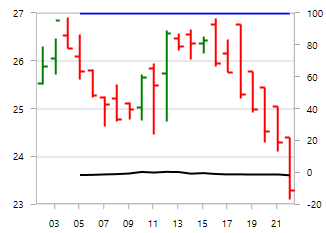
Stochastic
This indicator is used to measure the range and momentum of price movements. It contains KPeriod and DPeriod property defining the ‘K’ percentage and ‘D’ percentage respectively. No signal line in this indicator.
The UpperLineColor, LowerLineColor and PeriodLineColor property are used to define the brushes for the Stochastic indicator lines.
You can define stochastic technical indicator using the following code example:
<chart:SfChart.TechnicalIndicators>
    <chart:StochasticTechnicalIndicator
        ItemsSource="{Binding ViewModel1}"
        Period="3"
        KPeriod="8"
        DPeriod="5"
        SignalLineColor="Black"
        XBindingPath="Date"
        Volume="Volume"
        UpperLineColor="Blue"
        LowerLineColor="LightBlue"
        PeriodLineColor="Blue"
        High="High"
        Low="Low"
        Open="Open"
        Close="Close"/>
</chart:SfChart.TechnicalIndicators>
StochasticTechnicalIndicator indicator = new StochasticTechnicalIndicator()
{
ItemsSource = new ViewModel().ViewModel1,
XBindingPath = "Date",
Volume = "Volume",
Open = "Open",
Close = "Close",
High = "High",
Low = "Low",
Period = 3,
KPeriod = 8,
DPeriod = 5,
SignalLineColor = new SolidColorBrush(Colors.Black),
PeriodLineColor = new SolidColorBrush(Colors.Red),
UpperLineColor = new SolidColorBrush(Colors.Blue),
LowerLineColor = new SolidColorBrush(Colors.Purple)
};
chart.TechnicalIndicators.Add(indicator);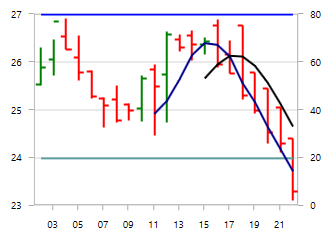
Exponential Average
The ExponentialAverageIndicator is similar to SimpleAverageIndicator and this can be defined using the following code examples.
<chart:SfChart.TechnicalIndicators>
    <chart:ExponentialAverageIndicator
        ItemsSource="{Binding ViewModel1}"
        Period="3"
        XBindingPath="Date"
        Volume="Volume"
        SignalLineColor="Black"
        High="High"
        Low="Low"
        Open="Open"
        Close="Close"/>
</chart:SfChart.TechnicalIndicators>
ExponentialAverageIndicator indicator = new ExponentialAverageIndicator()
{
ItemsSource = new ViewModel().ViewModel1,
XBindingPath = "Date",
Open = "Open",
Close = "Close",
High = "High",
Low = "Low",
Volume = "Volume",
Period = 3,
SignalLineColor = new SolidColorBrush(Colors.Black)
};
chart.TechnicalIndicators.Add(indicator);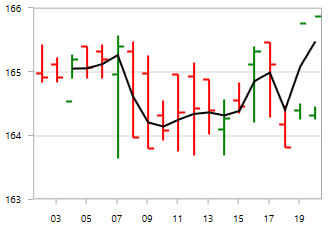
Triangular Average
The TriangularAverageIndicator can be defined as in the following code example.
<chart:SfChart.TechnicalIndicators>
    <chart:TriangularAverageIndicator
        ItemsSource="{Binding ViewModel1}"
        Period="3"
        XBindingPath="Date"
        Volume="Volume"
        SignalLineColor="Black"
        High="High"
        Low="Low"
        Open="Open"
        Close="Close"/>
</chart:SfChart.TechnicalIndicators>
TriangularAverageIndicator indicator = new TriangularAverageIndicator()
{
ItemsSource = new ViewModel().StockPriceDetails,
XBindingPath = "Date",
Open = "Open",
Close = "Close",
High = "High",
Low = "Low",
Volume = "Volume",
Period = 3
SignalLineColor = new SolidColorBrush(Colors.Black)
};
chart.TechnicalIndicators.Add(indicator);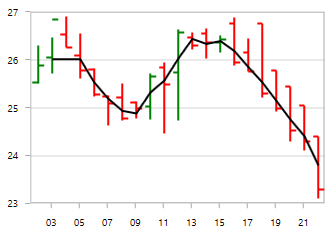
Accumulation Distribution
The following code example help you to add AccumulationDistributionIndicator.
<chart:SfChart.TechnicalIndicators>
    <chart:AccumulationDistributionIndicator
        ItemsSource="{Binding ViewModel1}"
        XBindingPath="Date"
        Volume="Volume"
        SignalLineColor="Black"
        High="High"
        Low="Low"
        Open="Open"
        Close="Close">
    </chart:AccumulationDistributionIndicator>
</chart:SfChart.TechnicalIndicators>
AccumulationDistributionIndicator indicator = new AccumulationDistributionIndicator()
{
ItemsSource = new ViewModel().StockPriceDetails,
XBindingPath = "Date",
Open = "Open",
Close = "Close",
High = "High",
Low = "Low",
Volume = "Volume",
SignalLineColor = new SolidColorBrush(Colors.Black)
};
chart.TechnicalIndicators.Add(indicator);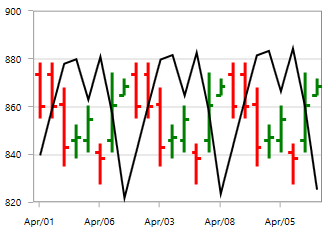
Bollinger Band
This indicator also having UpperLineColor, LowerLineColor and SignalLineColor property for defining the brushes for the indicator lines.
You can define the BollingerBandIndicator using the following code example:
<chart:SfChart.TechnicalIndicators>
    <chart:BollingerBandIndicator
        ItemsSource="{Binding ViewModel1}"
        Period="3"
        UpperLineColor="Blue"
        LowerLineColor="Red"
        XBindingPath="Date"
        Volume="Volume"
        SignalLineColor="Black"
        High="High"
        Low="Low"
        Open="Open"
        Close="Close"/>
</chart:SfChart.TechnicalIndicators>
BollingerBandIndicator indicator = new BollingerBandIndicator()
{
ItemsSource = new ViewModel().ViewModel1,
XBindingPath = "Date",
Open = "Open",
Close = "Close",
High = "High",
Low = "Low",
Volume = "Volume",
Period = 3,
SignalLineColor = new SolidColorBrush(Colors.Black),
UpperLineColor = new SolidColorBrush(Colors.Blue),
LowerLineColor = new SolidColorBrush(Colors.Red)
};
chart.TechnicalIndicators.Add(indicator);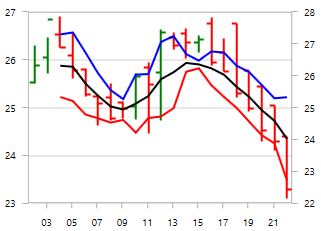
MACD
This is mostly using indicator having ShortPeriod and LongPeriod for defining the motion of the indicator.
Other than signal line, MACD is having convergence and divergence line. The brushes for these lines can be defined using ConvergenceLineColor and DivergenceLineColor.
Also you can draw Line, Histogram MACD or Both using the Type property, which defines the type of MACD to be drawn.
You can define the MACDTechnicalIndicator using the following code example:
<chart:SfChart.TechnicalIndicators>
    <chart:MACDTechnicalIndicator
        ItemsSource="{Binding ViewModel1}"
        Type="Line"
        ShortPeriod="2"
        Period="3"
        LongPeriod="6"
        ConvergenceLineColor="Red"
        DivergenceLineColor="Blue"
        XBindingPath="Date"
        Volume="Volume"
        SignalLineColor="Black"
        High="High"
        Low="Low"
        Open="Open"
        Close="Close">
    </chart:MACDTechnicalIndicator>
</chart:SfChart.TechnicalIndicators>
MACDTechnicalIndicator indicator = new MACDTechnicalIndicator()
{
ItemsSource = new ViewModel().StockPriceDetails,
XBindingPath = "Date",
Volume = "Volume",
Open = "Open",
Close = "Close",
High = "High",
Low = "Low",
Period = 3,
ShortPeriod = 2,
LongPeriod = 6,
Type = MACDType.Line,
SignalLineColor = new SolidColorBrush(Colors.Black),
ConvergenceLineColor = new SolidColorBrush(Colors.Red),
DivergenceLineColor = new SolidColorBrush(Colors.Blue)
};
chart.TechnicalIndicators.Add(indicator);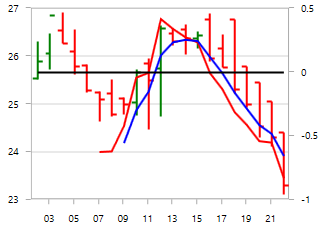
NOTE
You can refer to our WPF Charts feature tour page for its groundbreaking feature representations. You can also explore our WPF Charts example to know various chart types and how to easily configure them with built-in support for creating stunning visual effects.