Custom Charts in WPF (SfChart)
8 Jul 20264 minutes to read
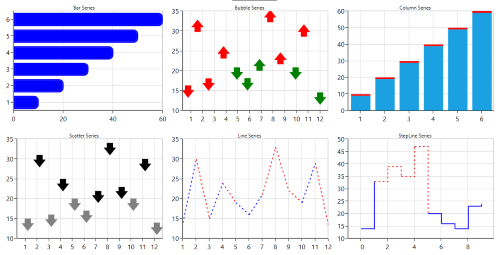
CustomTemplate property is used to customize the chart series. It supports the following series
- BarSeries
- BubbleSeries
- ColumnSeries
- LineSeries
- ScatterSeries
- SplineSeries
- StackingBarSeries
- StackingBar100Series
- StackingColumnSeries
- StackingColumn100Series
- StepLineSeries
- FastLineSeries
- RangeColumnSeries
The respective segment of each series will be your DataTemplate context, which contains the following properties in common. This will be used to plot the custom shapes for the series.
-
XData-Returns the actual X value of the segment. -
YData-Returns the actual Y value of the segment. -
Item-Returns the underlying model object of the segment. -
Interior-Returns the brush color of the segment.
The following code example illustrates the use of CustomTemplate property:
<syncfusion:SfChart x:Name="chart">
     <syncfusion:SfChart.Resources>
         <local:ScatterInteriorConverter x:Key="scatterInteriorConverter"/>
         <local:ScatterAngleConverter x:Key="scatterAngleConverter"/>
         <DataTemplate x:Key="seriesTemplate">
             <Canvas>
                 <Path
                     Fill="{Binding Converter={StaticResource scatterInteriorConverter}}"
                     Stretch="Fill"
                     Height="{Binding ScatterHeight}"
                     Width="{Binding ScatterWidth}"
                     RenderTransformOrigin="0.5,0.5"
                     Canvas.Left="{Binding RectX}"
                     Canvas.Top="{Binding RectY}"
                     Data="M20.125,32L0.5,12.375L10.3125,12.375L10.3125,
                         0.5L29.9375,0.5L29.9375,12.375L39.75,12.375z">
                     <Path.RenderTransform>
                         <RotateTransform Angle="{Binding Converter={StaticResource scatterAngleConverter}}"/>
                     </Path.RenderTransform>
                 </Path>
             </Canvas>
         </DataTemplate>
     </syncfusion:SfChart.Resources>

     <syncfusion:ScatterSeries
         ScatterHeight="20"
         ScatterWidth="20"
         Interior="Gray"
         XBindingPath="Year"
         YBindingPath="Count"
         ItemsSource="{Binding Data}"
         CustomTemplate="{StaticResource seriesTemplate}"/>
 </syncfusion:SfChart>
ScatterSeries series = new ScatterSeries()
{
ItemsSource = new ViewModel().Data,
XBindingPath = "Year",
YBindingPath = "Count",
ScatterHeight = 20,
ScatterWidth = 20,
Interior = new SolidColorBrush(Colors.DarkGray),
CustomTemplate = chart.Resources["seriesTemplate"] as DataTemplate
};
chart.Series.Add(series);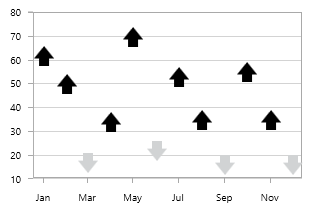
The BarSeries, BubbleSeries, ColumnSeries, LineSeries, ScatterSeries and StepLineSeries have been customized using the CustomTemplate property. Refer to this sample for complete series CustomTemplate.