Radar and Polar in WPF Charts (SfChart)
8 Jul 20268 minutes to read
Radar Chart
RadarSeries represents a collection of data, displayed by quantitative variables, represented by axes starting from the same point. The relative position and angle of the axes is not uniform.
The following code example illustrates the use of radar series:
<chart:RadarSeries
    ItemsSource="{Binding PlantDetails}"
    Interior="#BCBCBC"
    XBindingPath="Direction"
    YBindingPath="Tree"/>
RadarSeries series = new RadarSeries()
{
ItemsSource = new ViewModel().PlantDetails,
XBindingPath = "Direction",
YBindingPath = "Tree",
Interior = new SolidColorBrush(Color.FromRgb(0xBC, 0xBC, 0XBC))
};
chart.Series.Add(series);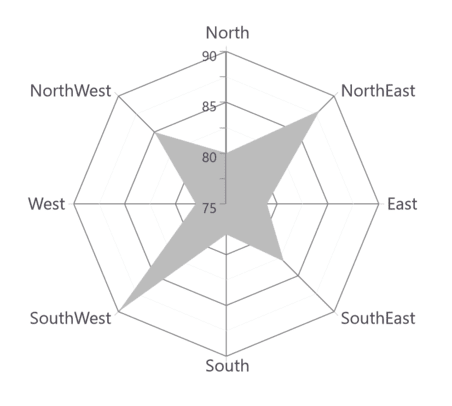
NOTE
You can explore our WPF Radar Chart feature tour page for its groundbreaking features. You can also explore our WPF Radar Chart example to know how to represent time-dependent data, showing trends in data at equal intervals.
Polar Chart
PolarSeries displays data points that are grouped by category, on a 360 degree circle. The following code example shows how to use polar series.
<chart:PolarSeries
    Interior="#4A4A4A"
    ItemsSource="{Binding PlantDetails}"
    XBindingPath="Direction"
    YBindingPath="Tree"/>
PolarSeries series = new PolarSeries()
{
ItemsSource = new ViewModel().PlantDetails,
XBindingPath = "Direction",
YBindingPath = "Tree",
Interior = new SolidColorBrush(Color.FromRgb(0x4A, 0x4A, 0X4A))
};
chart.Series.Add(series);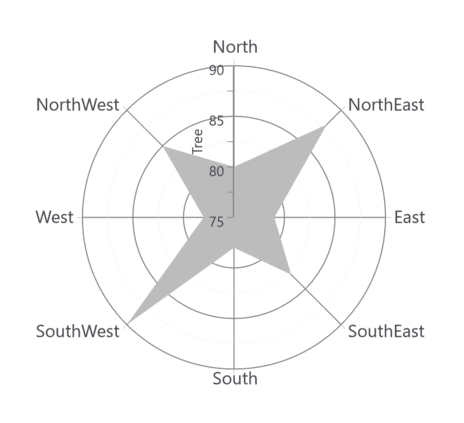
The Radar and Polar charts having the following properties in common:
IsClosed
This property used to draw the closed path as below.
<chart:PolarSeries
    x:Name="series1"
    Interior="#4A4A4A"
    ItemsSource="{Binding PlantDetails}"
    Label="Amount Spent"
    DrawType="Line"
    IsClosed="False"
    XBindingPath="Direction"
    YBindingPath="Tree"
    StrokeThickness="2"/>
PolarSeries series = new PolarSeries()
{
ItemsSource = new ViewModel().PlantDetails,
XBindingPath = "Direction",
YBindingPath = "Tree",
IsClosed = false,
DrawType = ChartSeriesDrawType.Line,
Label = "Amount Spent",
StrokeThickness = 2,
Interior = new SolidColorBrush(Color.FromRgb(0x4A, 0x4A, 0X4A))
};
chart.Series.Add(series);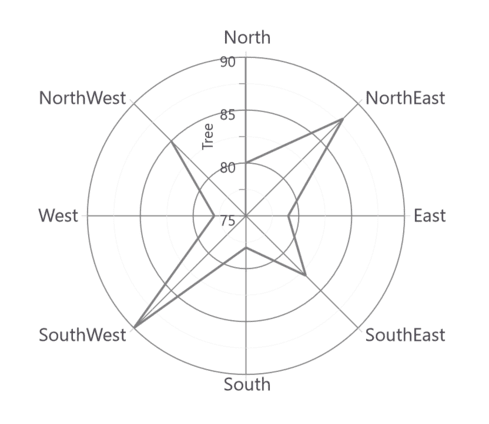
DrawType
This property defines type of curve, whether its Line or Area.
DrawType as Area
<chart:PolarSeries
    x:Name="series1"
    Interior="#4A4A4A"
    ItemsSource="{Binding PlantDetails}"
    DrawType="Area"
    IsClosed="True"
    XBindingPath="Direction"
    YBindingPath="Tree"/>
PolarSeries series = new PolarSeries()
{
ItemsSource = new ViewModel().PlantDetails,
XBindingPath = "Direction",
YBindingPath = "Tree",
IsClosed = True,
DrawType = ChartSeriesDrawType.Area,
Interior = new SolidColorBrush(Color.FromRgb(0x4A, 0x4A, 0X4A))
};
chart.Series.Add(series);
DrawType as Line
<chart:PolarSeries
    x:Name="series1"
    Interior="#4A4A4A"
    ItemsSource="{Binding PlantDetails}"
    DrawType="Line"
    IsClosed="True"
    XBindingPath="Direction"
    YBindingPath="Tree"
    StrokeThickness="2"/>
PolarSeries series = new PolarSeries()
{
ItemsSource = new ViewModel().PlantDetails,
XBindingPath = "Direction",
YBindingPath = "Tree",
IsClosed = True,
DrawType = ChartSeriesDrawType.Line,
StrokeThickness = 2,
Interior = new SolidColorBrush(Color.FromRgb(0x4A, 0x4A, 0X4A))
};
chart.Series.Add(series);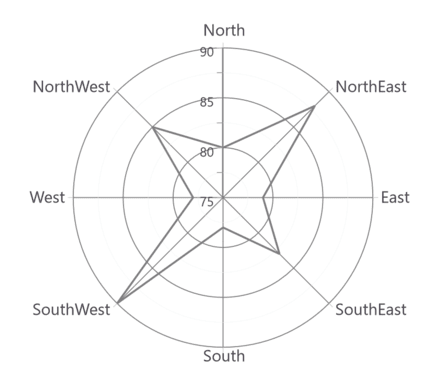
Polar Angle
Chart axis provides support to render polar and radar series on 0,90,180 and 270 degrees. It can be achieved by its PolarAngle property.The PolarAngle is type of ChartPolarAngle and its default value is Rotate270.Rotate0, Rotate90 and Rotate180 are another supported values of PolarAngle. Both the primary and secondary axes can be rotated individually based on its PolarAngle value.
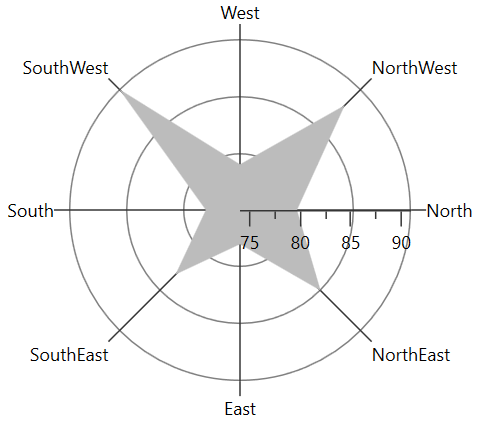
Rotate0
The below snippet explains how the axes of series has been rotated when PolarAngle value is Rotate0,
<chart:SfChart.PrimaryAxis>
    <chart:CategoryAxis  PolarAngle="Rotate0"/>
</chart:SfChart.PrimaryAxis>

<chart:SfChart.SecondaryAxis>
    <chart:NumericalAxis PolarAngle="Rotate0"/>
</chart:SfChart.SecondaryAxis>chart.PrimaryAxis = new CategoryAxis()
{
PolarAngle = ChartPolarAngle.Rotate0
};
chart.SecondaryAxis = new NumericalAxis()
{
PolarAngle = ChartPolarAngle.Rotate0
};
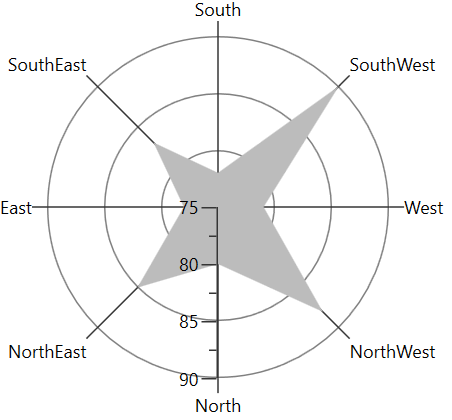
Rotate90
The below snippet explains how the axes of series has been rotated when PolarAngle value is Rotate90,
<chart:SfChart.PrimaryAxis>
    <chart:CategoryAxis PolarAngle="Rotate90"/>
</chart:SfChart.PrimaryAxis>

<chart:SfChart.SecondaryAxis>
    <chart:NumericalAxis PolarAngle="Rotate90"/>
</chart:SfChart.SecondaryAxis>chart.PrimaryAxis = new CategoryAxis()
{
PolarAngle = ChartPolarAngle.Rotate90
};
chart.SecondaryAxis = new NumericalAxis()
{
PolarAngle = ChartPolarAngle.Rotate90
};
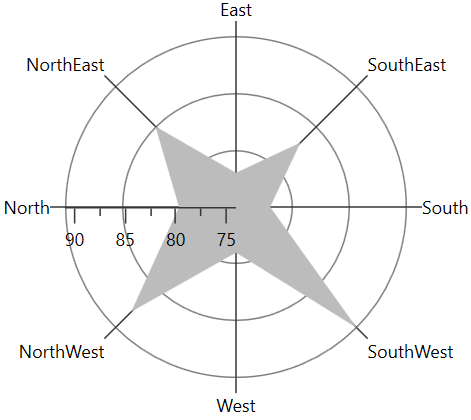
Rotate180
The below snippet explains how the axes of series has been rotated when PolarAngle value is Rotate180,
<chart:SfChart.PrimaryAxis>
    <chart:CategoryAxis PolarAngle="Rotate180"/>
</chart:SfChart.PrimaryAxis>

<chart:SfChart.SecondaryAxis>
    <chart:NumericalAxis PolarAngle="Rotate180"/>
</chart:SfChart.SecondaryAxis>chart.PrimaryAxis = new CategoryAxis()
{
PolarAngle = ChartPolarAngle.Rotate180
};
chart.SecondaryAxis = new NumericalAxis()
{
PolarAngle = ChartPolarAngle.Rotate180
};
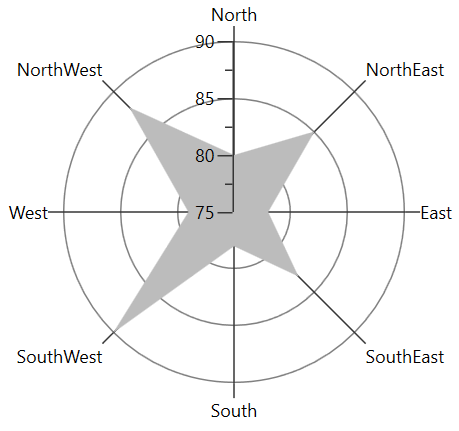
Rotate270
The below snippet explains how the axes of series has been rotated, when PolarAngle value is Rotate270,
<chart:SfChart.PrimaryAxis>
    <chart:CategoryAxis PolarAngle="Rotate270"/>
</chart:SfChart.PrimaryAxis>

<chart:SfChart.SecondaryAxis>
    <chart:NumericalAxis PolarAngle="Rotate270"/>
</chart:SfChart.SecondaryAxis>chart.PrimaryAxis = new CategoryAxis()
{
PolarAngle = ChartPolarAngle.Rotate270
};
chart.SecondaryAxis = new NumericalAxis()
{
PolarAngle = ChartPolarAngle.Rotate270
};
NOTE
You can explore our WPF Polar Chart feature tour page for its groundbreaking features. You can also explore our WPF Polar Chart example to know how to render and configure the polar line type charts.