Spline in WPF Charts (SfChart)
8 Jul 20265 minutes to read
Spline Chart
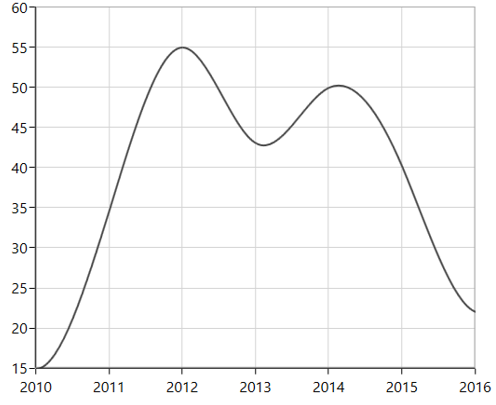
SplineSeries resembles line series, but the difference between them is that instead of connecting the data points with line segments, the data points are connected by smooth Bezier curves.
<chart:SplineSeries
    XBindingPath="Year"
    ItemsSource="{Binding List}"
    YBindingPath="India"
    Interior="#4A4A4A"/>

<chart:SplineSeries
    XBindingPath="Year"
    ItemsSource="{Binding List}"
    YBindingPath="America"
    Interior="#4A4A4A"/>
SplineSeries series1 = new SplineSeries()
{
ItemsSource = new ViewModel().List,
XBindingPath = "Year",
YBindingPath = "India",
Interior = new SolidColorBrush(Color.FromRgb(0x4A, 0x4A, 0x4A))
};
SplineSeries series2 = new SplineSeries()
{
ItemsSource = new ViewModel().List,
XBindingPath = "Year",
YBindingPath = "America",
Interior = new SolidColorBrush(Color.FromRgb(0x4A, 0x4A, 0x4A))
};
chart.Series.Add(series1);
chart.Series.Add(series2);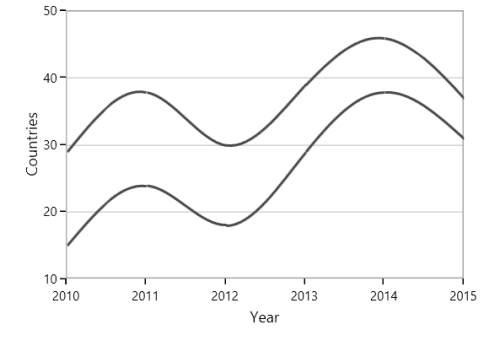
Dashed Lines
StrokeDashArray property of the SplineSeries is used to render spline series with dashes.
<chart:SplineSeries ItemsSource="{Binding List}" XBindingPath="Year" YBindingPath="India" StrokeDashArray="5,3" />SplineSeries series = new SplineSeries()
{
ItemsSource = new ViewModel().List,
XBindingPath = "Year",
YBindingPath = "India"
};
DoubleCollection doubleCollection = new DoubleCollection();
doubleCollection.Add(5);
doubleCollection.Add(3);
series.StrokeDashArray = doubleCollection;
chart.Series.Add(series);NOTE
You can explore our WPF Spline Chart feature tour page for its groundbreaking features. You can also explore our WPF Spline Chart example to know how to display multiple series of data as spline.
Spline Area Chart
SplineAreaSeries connects a series of data points using smooth Bezier line curves, with the underlying areas filled.
SplineAreaSeries series = new SplineAreaSeries()
{
    ItemsSource = new ViewModel().Products,
    XBindingPath = "ProdName",
    YBindingPath = "Price",
    Interior = new SolidColorBrush(Color.FromRgb(0x7F, 0x7F, 0x7F))
};
chart.Series.Add(series);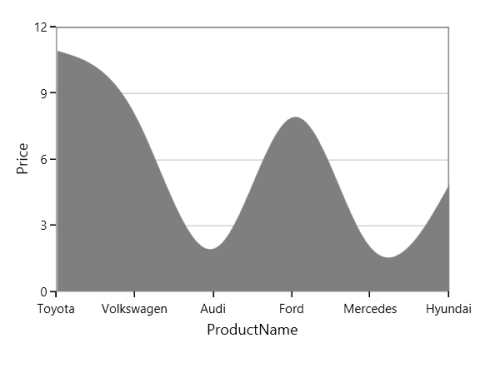
NOTE
You can explore our WPF Spline Area Chart feature tour page for its groundbreaking features. You can also explore our WPF Spline Area Chart example to know how to display multiple series of data as a spline area.
Spline Type
Spline and SplineArea series provide support for various spline type. The spline type of the series can be changed by using its SplineType property. The following spline types are supported by Spline and SplineArea series:
Cardinal
The cardinal spline algorithm ensures that the resulting curve passes through each data point, while also providing a smooth and visually appealing interpolation with continuous derivatives up to a certain order at each point.
The following code illustrates how to set the SplineType value as Cardinal.
<chart:SplineSeries SplineType="Monotonic"></chart:SplineSeries>SplineSeries series = new SplineSeries();
series.SplineType = SplineType.Cardinal;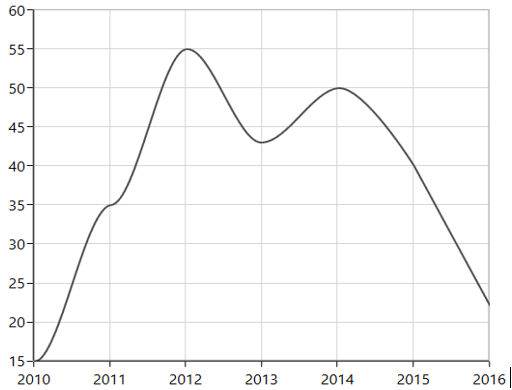
Monotonic
The monotonic spline algorithm ensures that the resulting curve is non-decreasing (or non-increasing) between each pair of adjacent points. This means that if the data points increase (or decrease) monotonically, the resulting curve will follow the same trend without any oscillations or inflections.
The following code illustrates how to set the SplineType value as Monotonic.
<chart:SplineSeries SplineType="Monotonic"></chart:SplineSeries>SplineSeries series = new SplineSeries();
series.SplineType = SplineType.Monotonic;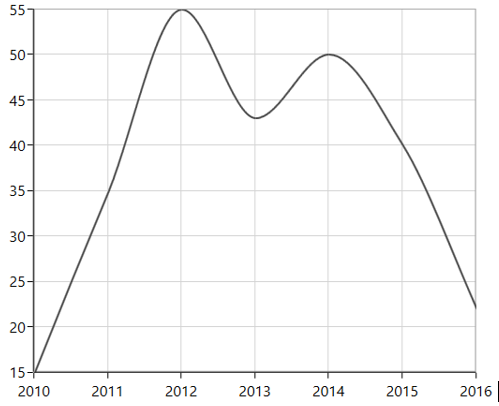
Clamped
The clamped splines algorithm ensures that the resulting curve passes through the first and last data points and has a specified slope or curvature at these endpoints, thus ensuring that the curve is well-behaved at the boundaries and does not exhibit any unusual behavior.
The following code illustrates how to set the SplineType value as Clamped.
<chart:SplineSeries SplineType="Clamped"></chart:SplineSeries>SplineSeries series = new SplineSeries();
series.SplineType = SplineType.Clamped;