Area Series in WPF Charts (SfChart)
8 Jul 20263 minutes to read
Area Chart
AreaSeries is rendered using a collection of line segments connected to form a closed loop area, filled with the specified color.
The following code example initializes the AreaSeries:
<chart:AreaSeries
    XBindingPath="FruitName"
    Interior="#BCBCBC"
    YBindingPath="People"
    ItemsSource="{Binding Fruits}">
</chart:AreaSeries>
AreaSeries series = new AreaSeries()
{
ItemsSource = new ViewModel().Fruits,
XBindingPath = "FruitName",
YBindingPath = "People",
Interior = new SolidColorBrush(Color.FromRgb(0xBC, 0xBC, 0xBC))
};
chart.Series.Add(series);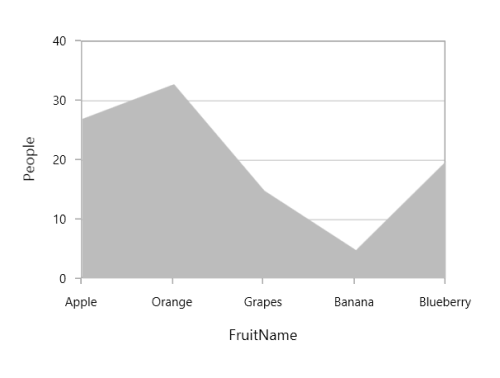
NOTE
You can refer to our WPF Area Chart feature tour page for its groundbreaking feature representations. You can also explore our WPF Area Chart example to know how to render and configure the area chart.
Step Area Chart
StepAreaSeries is similar to AreaSeries but it does not use the shortest distance to connect two data points using Bezier curves. Instead, this ChartSeries uses vertical and horizontal lines to connect the data points in a series forming a step-like progression.
<chart:StepAreaSeries
    Interior="#7F7F7F"
    ItemsSource="{Binding SneakersDetail}"
    XBindingPath="Brand"
    YBindingPath="ItemsCount">
</chart:StepAreaSeries>
StepAreaSeries series = new StepAreaSeries()
{
ItemsSource = new ViewModel().SneakersDetail,
XBindingPath = "Brand",
YBindingPath = "ItemsCount",
Interior = new SolidColorBrush(Color.FromRgb(0x7F, 0x7F, 0x7F))
};
chart.Series.Add(series);
NOTE
You can explore our WPF Step Area Chart feature tour page for its groundbreaking features. You can also explore our WPF Step Area Chart example to know how to represent time-dependent data, showing trends in data at equal intervals.
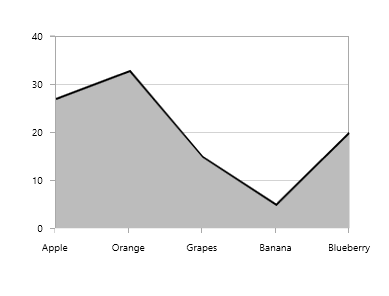
Closed Area Chart
If you wish to draw the open area series (Area with stroke only at top), SfChart provides IsClosed property. By default, this property is true.
<chart:AreaSeries
    IsClosed="False"
    XBindingPath="FruitName"
    Interior="#BCBCBC"
    YBindingPath="People"
    ItemsSource="{Binding Fruits}">
</chart:AreaSeries>
AreaSeries series = new AreaSeries()
{
ItemsSource = new ViewModel().Fruits,
XBindingPath = "FruitName",
YBindingPath = "People",
IsClosed = true,
Interior = new SolidColorBrush(Color.FromRgb(0xBC, 0xBC, 0xBC))
};
chart.Series.Add(series);