Funnel and Pyramid in WPF Charts (SfChart)
8 Jul 20266 minutes to read
Pyramid Chart
PyramidSeries has the form of a triangle with lines dividing it into sections and each section has a different width. Depending on the Y co-ordinates, this width indicates a level of hierarchy among other categories.
<chart:PyramidSeries XBindingPath="Category" ItemsSource="{Binding Tax}" YBindingPath="Percentage"/>PyramidSeries series = new PyramidSeries()
{
ItemsSource = new ViewModel().Tax,
XBindingPath = "Category",
YBindingPath = "Percentage"
};
chart.Series.Add(series);
The PyramidMode is used to define the rendering mode such as Surface or Linear pyramid segments.
PyramidMode as Surface
<chart:PyramidSeries
    XBindingPath="Category"
    PyramidMode="Surface"
    ItemsSource="{Binding Tax}"
    YBindingPath="Percentage"/>
PyramidSeries series = new PyramidSeries()
{
ItemsSource = new ViewModel().Tax,
XBindingPath = "Category",
YBindingPath = "Percentage",
PyramidMode = ChartPyramidMode.Surface
};
chart.Series.Add(series);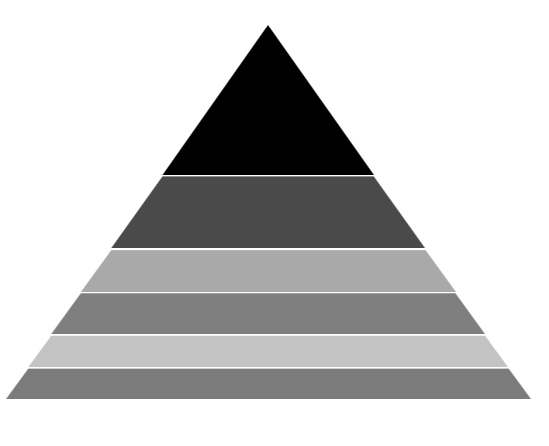
PyramidMode as Linear
<chart:PyramidSeries
    PyramidMode="Linear"
    ItemsSource="{Binding Tax}"
    XBindingPath="Category"
    YBindingPath="Percentage"/>
PyramidSeries series = new PyramidSeries()
{
ItemsSource = new ViewModel().Tax,
XBindingPath = "Category",
YBindingPath = "Percentage",
PyramidMode = ChartPyramidMode.Linear
};
chart.Series.Add(series);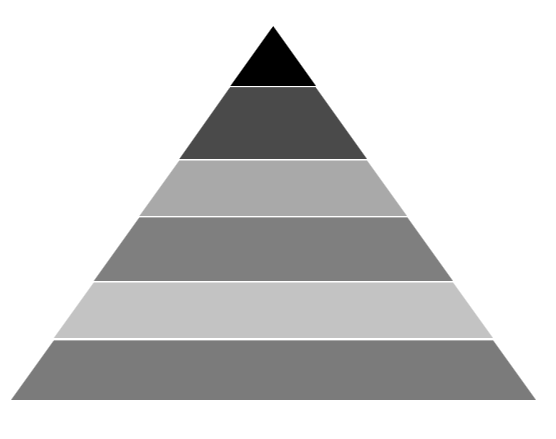
NOTE
You can explore our WPF Pyramid Chart feature tour page for its groundbreaking features. You can also explore our WPF Pyramid Chart example to know how to represent time-dependent data, showing trends in data at equal intervals.
Funnel Chart
FunnelSeries is similar to PyramidSeries, displays data in a funnel shape that equals to 100% when totaled. It is a single series, representing data as portions of 100% and does not use any axes.
The following code example shows how to use the funnel series:
<chart:FunnelSeries XBindingPath="Category" ItemsSource="{Binding List}" YBindingPath="Percentage"/>FunnelSeries series = new FunnelSeries()
{
ItemsSource = new ViewModel().List,
XBindingPath = "Category",
YBindingPath = "Percentage",
};
chart.Series.Add(series);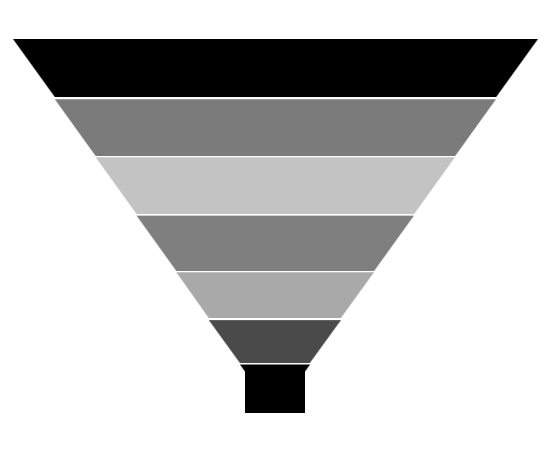
Funnel Mode
The FunnelMode defines a rendering mode for the funnel series which define, where to bind your values (to height or width). The following example demonstrates ValueIsHeight and ValueIsWidth funnel mode:
ValueIsHeight
<chart:FunnelSeries
    ItemsSource="{Binding List}"
    FunnelMode="ValueIsHeight"
    XBindingPath="Category"
    YBindingPath="Percentage"/>
FunnelSeries series = new FunnelSeries()
{
ItemsSource = new ViewModel().List,
XBindingPath = "Category",
YBindingPath = "Percentage",
FunnelMode = ChartFunnelMode.ValueIsHeight
};
chart.Series.Add(series);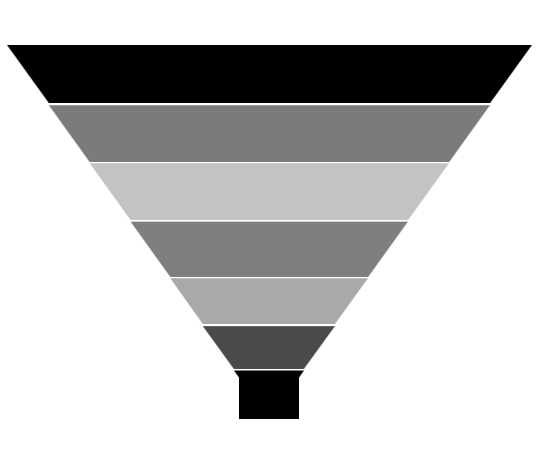
ValueIsWidth
<chart:FunnelSeries
    ItemsSource="{Binding List}"
    FunnelMode="ValueIsWidth"
    XBindingPath="Category"
    YBindingPath="Percentage"/>
FunnelSeries series = new FunnelSeries()
{
ItemsSource = new ViewModel().List,
XBindingPath = "Category",
YBindingPath = "Percentage",
FunnelMode = ChartFunnelMode.ValueIsWidth
};
chart.Series.Add(series);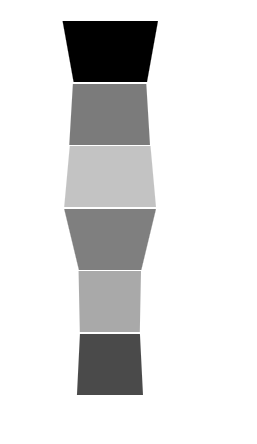
Explode Segments
The following properties are used to explode the individual segments in Funnel and Pyramid.
-
ExplodeAll- Used to explode all the segments of these series. -
ExplodeIndex- Used to explode any specific segment. -
ExplodeOffset- Used to define the explode distance like ExplodeRadius for Pie. -
ExplodeOnMouseClick-Used to explode the segment when segment is clicked.
Explode Offset
<chart:FunnelSeries
    XBindingPath="Category"
    ItemsSource="{Binding List}"
    ExplodeIndex="4"
    ExplodeOffset="70"
    YBindingPath="Percentage"/>
FunnelSeries series = new FunnelSeries()
{
ItemsSource = new ViewModel().List,
XBindingPath = "Category",
YBindingPath = "Percentage",
ExplodeIndex = 4,
ExplodeOffset = 70
};
chart.Series.Add(series);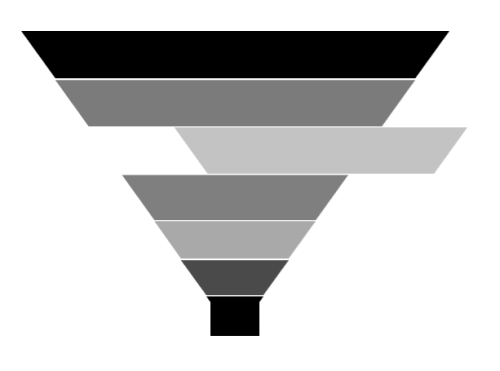
Gap Ratio
The gap between each segment using GapRatio property as in the following code example.
<chart:FunnelSeries
    XBindingPath="Category"
    ItemsSource="{Binding List}"
    GapRatio="0.5"
    YBindingPath="Percentage"/>
FunnelSeries series = new FunnelSeries()
{
ItemsSource = new ViewModel().List,
XBindingPath = "Category",
YBindingPath = "Percentage",
GapRatio = 0.5
};
chart.Series.Add(series);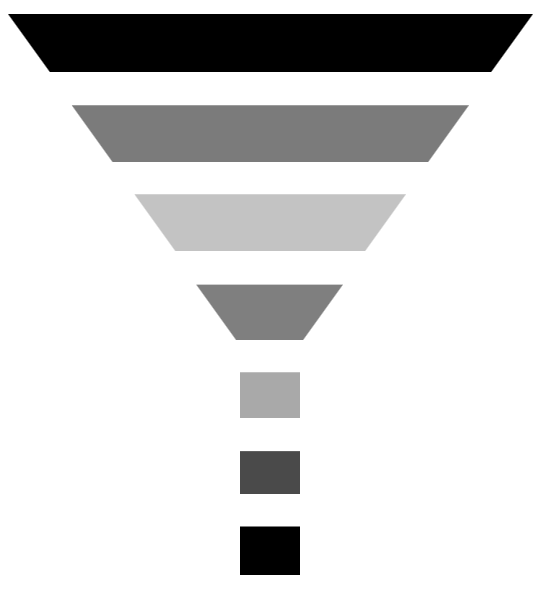
NOTE
You can refer to our WPF Funnel Chart feature tour page for its groundbreaking feature representations. You can also explore our WPF Funnel Chart example to know how to render and configure the funnel chart.