Financial in WPF Charts (SfChart)
8 Jul 20267 minutes to read
The APIs present in the financial series are,
-
High-Gets or sets the string that describes high value in Y-axis. -
Low- Gets or sets the string that describes low value in Y-axis. -
Open-Gets or sets the string that describes open value in Y-axis. -
Close- Gets or sets the string that describes close value in Y-axis. -
BearFillColor-Represents the brush color for the segments that show stock price has gone up in measured time interval. -
BullFillColor-Represents that brush color for the segments that show stock price has gone down in measured time interval. -
ComparisonMode- Specifies which price need to be considered for the formation fromHigh,Low,Open,CloseorNonefinancial price.
OHLC Chart
HiLoOpenCloseSeries displays each data point as a group of horizontal and one vertical line. The values for this series can be binded using High, Low, Open and Close property.
The following code example shows how to use OHLC series:
<chart:HiLoOpenCloseSeries
    Name="series"
    ItemsSource="{Binding StockPriceDetails}"
    XBindingPath="Date"
    High="High"
    Low="Low"
    Interior="#4A4A4A"
    Open="Open"
    Close="Close"
    Label="HiloOpenClose"/>
HiLoOpenCloseSeries series = new HiLoOpenCloseSeries()
{
ItemsSource = new ViewModel().StockPriceDetails,
XBindingPath = "Date",
High = "High",
Low = "Low",
Open = "Open",
Close = "Close",
Interior = new SolidColorBrush(Color.FromRgb(0x4A, 0x4A, 0X4A))
};
chart.Series.Add(series);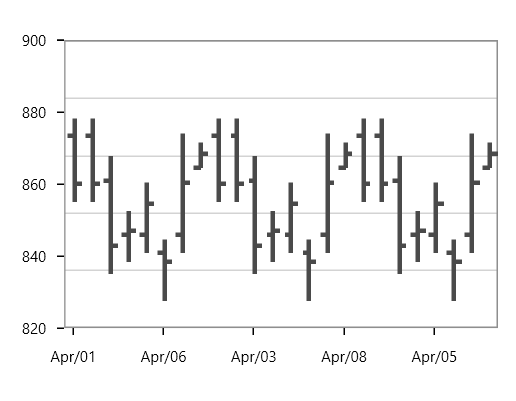
NOTE
You can explore our WPF OHLC Chart feature tour page for its groundbreaking features. You can also explore our WPF OHLC Chart example to know how to represent time-dependent data, showing trends in data at equal intervals.
Candle Chart
CandleSeries displays each data point as a combination of a vertical column and a vertical line. This series is most widely used in decision making places, like the stock market.
The values for this series can be bind using High, Low, Open and Close property and the following code example shows the usage of candle series.
<chart:CandleSeries
    Name="series"
    ItemsSource="{Binding StockPriceDetails}"
    XBindingPath="Date"
    High="High"
    Low="Low"
    Open="Open"
    Close="Close"
    Interior="#4A4A4A"/>
CandleSeries series = new CandleSeries()
{
ItemsSource = new ViewModel().StockPriceDetails,
XBindingPath = "Date",
High = "High",
Low = "Low",
Open = "Open",
Close = "Close",
Interior = new SolidColorBrush(Color.FromRgb(0x4A, 0x4A, 0X4A))
};
chart.Series.Add(series);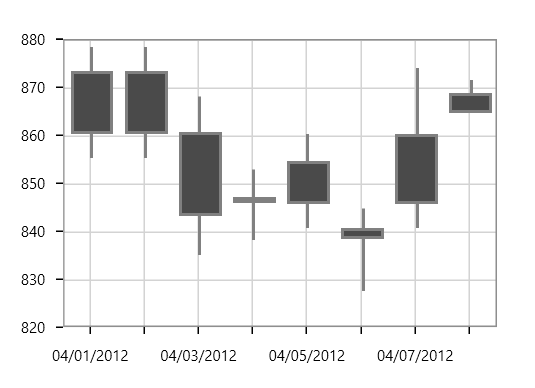
<chart:CandleSeries
    Name="series"
    ItemsSource="{Binding StockPriceDetails}"
    XBindingPath="Date"
    Open="Open"
    Close="Close"
    High="High"
    Low="Low"
    BearFillColor="Black"
    BullFillColor="#BCBCBC"/>
CandleSeries series = new CandleSeries()
{
ItemsSource = new ViewModel().StockPriceDetails,
XBindingPath = "Date",
High = "High", Low = "Low",
Open = "Open", Close = "Close",
BearFillColor = new SolidColorBrush(Colors.Black),
BullFillColor = new SolidColorBrush(Color.FromRgb(0xBC, 0xBC, 0XBC))
};
chart.Series.Add(series);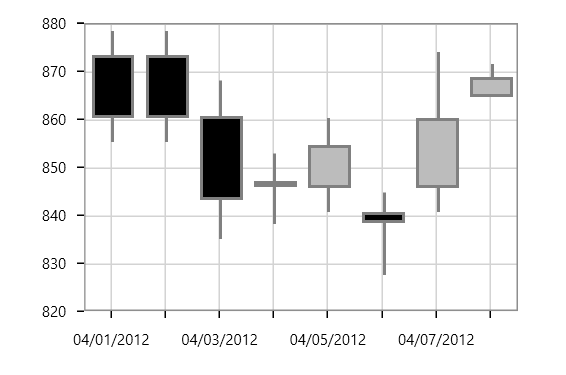
NOTE
You can refer to our WPF Candlestick Chart feature tour page for its groundbreaking feature representations. You can also explore our WPF Candlestick Chart example to know how to render and configure the candle chart.
Comparison Modes
ComparisonMode property of FinancialSeries is used to compare the current (High, Low, Open, and Close) values with previous (High, Low, Open, and Close) values in the series data points.
By default, the ComparisonMode value is None.
Comparing the open values
While setting the ComparisonMode value as Open, the open value of current segment will be compared to open value of previous segment.
<syncfusion:CandleSeries ComparisonMode="Open"></syncfusion:CandleSeries>CandleSeries series = new CandleSeries();
series.ComparisonMode = Syncfusion.UI.Xaml.Charts.FinancialPrice.Open;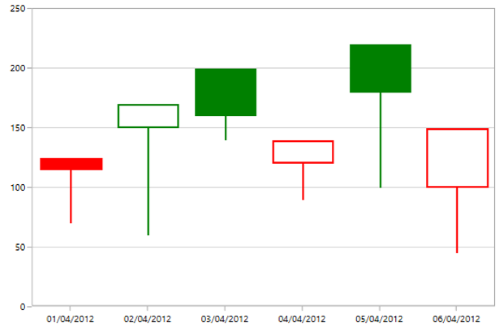
In the above screenshot, the second segment’s Open value is greater than the first segment’s open value. So, the stroke color is filled with bull fill color.
Comparing the close values
While setting the ComparisonMode value as Close, the close value of current segment will be compared to the close value of previous segment.
<syncfusion:CandleSeries ComparisonMode="Close"></syncfusion:CandleSeries>CandleSeries series = new CandleSeries();
series.ComparisonMode = Syncfusion.UI.Xaml.Charts.FinancialPrice.Close;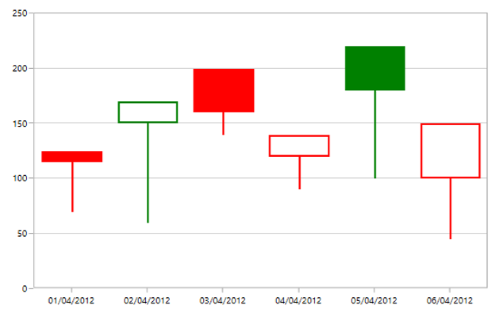
In the above screenshot, the second segment’s close value is greater than the first segment’s close value. So, the stroke color is filled with bull fill color.
Comparing the high values
While setting the ComparisonMode value as High, the high value of current segment will be compared to the high value of previous segment.
<syncfusion:CandleSeries ComparisonMode="High"></syncfusion:CandleSeries>CandleSeries series = new CandleSeries();
series.ComparisonMode = Syncfusion.UI.Xaml.Charts.FinancialPrice.High;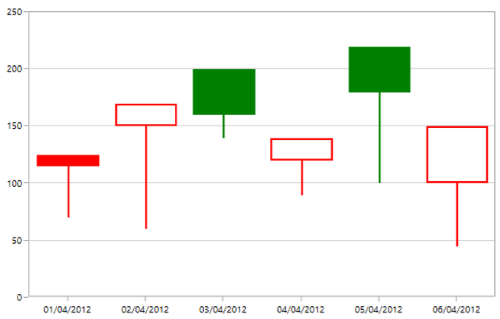
In the above screenshot, the second segment’s high value is less than the first segment’s high value. So, the stroke color is filled with bear fill color.
Comparing the low values
While setting the ComparisonMode value as Low, the low value of current segment will be compared to the low value of previous segment.
<syncfusion:CandleSeries ComparisonMode="Low"></syncfusion:CandleSeries>CandleSeries series = new CandleSeries();
series.ComparisonMode = Syncfusion.UI.Xaml.Charts.FinancialPrice.Low;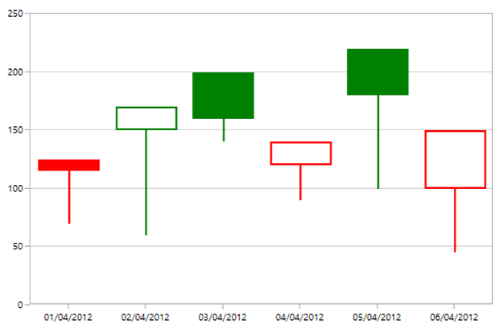
In the above screenshot, the second segment’s low value is greater than the first segment’s low value. So, the stroke color filled with bull fill color.