Rows in Windows Forms DataGrid (SfDataGrid)
21 Jan 202524 minutes to read
Row Header
Row Header is a special column which is placed as first cell of each row. Row header can be shown or hidden by setting ShowRowHeader property.
this.sfDataGrid1.ShowRowHeader = true;Me.sfDataGrid1.ShowRowHeader = True
Appearance
The appearance of row header can be customized by setting the SfDataGrid.RowHeaderStyle property. The RowHeaderStyle property contains all the settings that are needed for the row header appearance customization.
this.sfDataGrid1.Style.RowHeaderStyle.BackColor = Color.CadetBlue;Me.sfDataGrid1.Style.RowHeaderStyle.BackColor = Color.CadetBlue
Selection marker customization
The appearance of the selection marker can be customized using the selection marker properties in RowHeaderStyle.
this.sfDataGrid1.Style.RowHeaderStyle.SelectionMarkerThickness = 4;
this.sfDataGrid1.Style.RowHeaderStyle.SelectionMarkerColor = Color.Red;
this.sfDataGrid1.Style.RowHeaderStyle.SelectionBackColor = Color.White;Me.sfDataGrid1.Style.RowHeaderStyle.SelectionMarkerThickness = 4
Me.sfDataGrid1.Style.RowHeaderStyle.SelectionMarkerColor = Color.Red
Me.sfDataGrid1.Style.RowHeaderStyle.SelectionBackColor = Color.White
Row Indicators and its Description
|
Row Indicator |
Description |
|
|
Denotes row is AddNewRow. |

|
Denotes that the current row which has errors. |
Showing the Numbered Row Header
RowHeader cell can be customized by using DrawCell event which is raised for each cell. The default column index of the row header cell is zero, the style settings for a row header can be applied by using column index when it is enabled in SfDataGrid.
By default, the row header does not have the cell values. The numbers or any text can be set in the row header by setting the DisplayText which is available in the DrawCellEventArgs of DrawCell event.
this.sfDataGrid1.DrawCell += SfDataGrid1_DrawCell;

private void SfDataGrid1_DrawCell(object sender, DrawCellEventArgs e)
{
    if (sfDataGrid1.ShowRowHeader && e.RowIndex != 0)
    {
        if (e.ColumnIndex == 0)
        {
            e.DisplayText = e.RowIndex.ToString();
        }

    }
}
AddHandler sfDataGrid1.DrawCell, AddressOf SfDataGrid1_DrawCell
Private Sub SfDataGrid1_DrawCell(ByVal sender As Object, ByVal e As DrawCellEventArgs)
If sfDataGrid1.ShowRowHeader AndAlso e.RowIndex <> 0 Then
If e.ColumnIndex = 0 Then
e.DisplayText = e.RowIndex.ToString()
End If
End If
End Sub
Showing the image in RowHeader
You can display an image in the RowHeader by using the SfDataGrid.DrawCell event and by customizing the GridRowHeaderCellRenderer.
Using DrawCell event
The RowHeader cell can be customized by using the DrawCell event raised for each cell. The default column index of the row header cell is zero. The style settings for a row header can be applied using the column index when it is enabled in the SfDataGrid. The image can be drawn in the row header using DrawImage.
sfDataGrid1.DrawCell += OnSfDataGridDrawCell;

private void OnSfDataGridDrawCell(object sender, Syncfusion.WinForms.DataGrid.Events.DrawCellEventArgs e)
{
    if (sfDataGrid1.ShowRowHeader && e.RowIndex != 0)
    {
        double value = (e.DataRow.RowData as OrderInfo).UnitPrice;
        if (e.ColumnIndex == 0)
        {
            e.Handled = true;
            Rectangle rect = new Rectangle(e.Bounds.X + 3, e.Bounds.Y + 5, e.Bounds.Width - 3, e.Bounds.Height - 5);
            e.Graphics.FillRectangle(new SolidBrush(sfDataGrid1.Style.RowHeaderStyle.BackColor), new Rectangle(e.Bounds.X + 1, e.Bounds.Y + 1, e.Bounds.Width - 1, e.Bounds.Height - 1));
            //Draw the image on RowHeader
            if (value >= 0 && value < 50)
                e.Graphics.DrawImage(new Bitmap(Image.FromFile(@"..\..\Images\Yellow.png")), rect);
            else if (value > 51 && value < 100)
                e.Graphics.DrawImage(new Bitmap(Image.FromFile(@"..\..\Images\Green.png")), rect);
            else if (value > 101 && value < 600)
                e.Graphics.DrawImage(new Bitmap(Image.FromFile(@"..\..\Images\Red.png")), rect);
            e.Graphics.DrawLine(new Pen(ColorTranslator.FromHtml("#CCCCCC")), e.Bounds.Left, e.Bounds.Bottom, e.Bounds.Right, e.Bounds.Bottom);
        }
    }
}
AddHandler sfDataGrid1.DrawCell, AddressOf OnSfDataGridDrawCell
Private Sub OnSfDataGridDrawCell(ByVal sender As Object, ByVal e As Syncfusion.WinForms.DataGrid.Events.DrawCellEventArgs)
If sfDataGrid1.ShowRowHeader AndAlso e.RowIndex <> 0 Then
Dim value As Double = (TryCast(e.DataRow.RowData, OrderInfo)).UnitPrice
If e.ColumnIndex = 0 Then
e.Handled = True
Dim rect As New Rectangle(e.Bounds.X + 3, e.Bounds.Y + 5, e.Bounds.Width - 3, e.Bounds.Height - 5)
e.Graphics.FillRectangle(New SolidBrush(sfDataGrid1.Style.RowHeaderStyle.BackColor), New Rectangle(e.Bounds.X + 1, e.Bounds.Y + 1, e.Bounds.Width - 1, e.Bounds.Height - 1))
'Draw the image on RowHeader
If value >= 0 AndAlso value < 50 Then
e.Graphics.DrawImage(New Bitmap(Image.FromFile("..\..\Images\Yellow.png")), rect)
ElseIf value > 51 AndAlso value < 100 Then
e.Graphics.DrawImage(New Bitmap(Image.FromFile("..\..\Images\Green.png")), rect)
ElseIf value > 101 AndAlso value < 600 Then
e.Graphics.DrawImage(New Bitmap(Image.FromFile("..\..\Images\Red.png")), rect)
End If
e.Graphics.DrawLine(New Pen(ColorTranslator.FromHtml("#CCCCCC")), e.Bounds.Left, e.Bounds.Bottom, e.Bounds.Right, e.Bounds.Bottom)
End If
End If
End SubUsing custom RowHeaderCellRenderer
The following code shows how to draw an image in the row header by overriding the OnRender method in GridRowHeaderCellRenderer.
this.sfDataGrid1.CellRenderers["RowHeader"] = new CustomRowHeaderCellRenderer(sfDataGrid1);

public class CustomRowHeaderCellRenderer : GridRowHeaderCellRenderer
{
    SfDataGrid DataGrid { get; set; }
    public CustomRowHeaderCellRenderer(SfDataGrid dataGrid)
    {
        DataGrid = dataGrid;
    }
    protected override void OnRender(Graphics paint, Rectangle cellRect, string cellValue, CellStyleInfo style, DataColumnBase column, RowColumnIndex rowColumnIndex)
    {
        var rowData = this.DataGrid.View.Records[rowColumnIndex.RowIndex];
        double value = (rowData.Data as OrderInfo).UnitPrice;
        //Draw the image on RowHeader
        if (rowColumnIndex.RowIndex > 0)
        {
            if (value > 0 && value < 50)
                paint.DrawImage(new Bitmap(Image.FromFile(@"..\..\Images\Yellow.png")), new Rectangle(cellRect.X + 3, cellRect.Y + 5, cellRect.Width - 3, cellRect.Height - 5));
            else if (value > 51 && value < 100)
                paint.DrawImage(new Bitmap(Image.FromFile(@"..\..\Images\Green.png")), new Rectangle(cellRect.X + 3, cellRect.Y + 5, cellRect.Width - 3, cellRect.Height - 5));
            else if (value > 101 && value < 600)
                paint.DrawImage(new Bitmap(Image.FromFile(@"..\..\Images\Red.png")), new Rectangle(cellRect.X + 3, cellRect.Y + 5, cellRect.Width - 3, cellRect.Height - 5));
        }
    }
}
Public Class CustomRowHeaderCellRenderer
Inherits GridRowHeaderCellRenderer
Private Property DataGrid() As SfDataGrid
Public Sub New(ByVal dataGrid As SfDataGrid)
Me.DataGrid = dataGrid
End Sub
Protected Overrides Sub OnRender(ByVal paint As Graphics, ByVal cellRect As Rectangle, ByVal cellValue As String, ByVal style As CellStyleInfo, ByVal column As DataColumnBase, ByVal rowColumnIndex As RowColumnIndex)
Dim rowData = Me.DataGrid.View.Records(rowColumnIndex.RowIndex)
Dim value As Double = (TryCast(rowData.Data, OrderInfo)).UnitPrice
'Draw the image on RowHeader
If rowColumnIndex.RowIndex > 0 Then
If value > 0 AndAlso value < 50 Then
paint.DrawImage(New Bitmap(Image.FromFile("..\..\Images\Yellow.png")), New Rectangle(cellRect.X + 3, cellRect.Y + 5, cellRect.Width - 3, cellRect.Height - 5))
ElseIf value > 51 AndAlso value < 100 Then
paint.DrawImage(New Bitmap(Image.FromFile("..\..\Images\Green.png")), New Rectangle(cellRect.X + 3, cellRect.Y + 5, cellRect.Width - 3, cellRect.Height - 5))
ElseIf value > 101 AndAlso value < 600 Then
paint.DrawImage(New Bitmap(Image.FromFile("..\..\Images\Red.png")), New Rectangle(cellRect.X + 3, cellRect.Y + 5, cellRect.Width - 3, cellRect.Height - 5))
End If
End If
End Sub
End Class
Header Row
Header row is present in top of the SfDataGrid which has column headers in it. Column header describes the caption to identify the column content.

Appearance
The Appearance of the header row can be customized by using SfDataGrid.Style.HeaderStyle property.
this.sfDataGrid1.Style.HeaderStyle.BackColor = Color.AliceBlue;
this.sfDataGrid1.Style.HeaderStyle.TextColor = Color.DarkSlateBlue;
this.sfDataGrid1.Style.HeaderStyle.Font.Bold = true;Me.sfDataGrid1.Style.HeaderStyle.BackColor = Color.AliceBlue
Me.sfDataGrid1.Style.HeaderStyle.TextColor = Color.DarkSlateBlue
Me.sfDataGrid1.Style.HeaderStyle.Font.Bold = True
The appearance of any particular column header can be customized by using
GridColumnBase.HeaderStyle property.
this.sfDataGrid1.Columns["OrderID"].HeaderStyle.BackColor = Color.LightCoral;
this.sfDataGrid1.Columns["OrderID"].HeaderStyle.TextColor = Color.DarkRed;
this.sfDataGrid1.Columns["OrderID"].HeaderStyle.Font.Bold = true;Me.sfDataGrid1.Columns("OrderID").HeaderStyle.BackColor = Color.LightCoral
Me.sfDataGrid1.Columns("OrderID").HeaderStyle.TextColor = Color.DarkRed
Me.sfDataGrid1.Columns("OrderID").HeaderStyle.Font.Bold = True
Font orientation for Header Row
Font orientation of the header row can be set by using the HeaderStyle.Font.Orientation property.
this.sfDataGrid1.HeaderRowHeight = 80;
this.sfDataGrid1.Style.HeaderStyle.Font.Orientation = 45;Me.sfDataGrid1.HeaderRowHeight = 80
Me.sfDataGrid1.Style.HeaderStyle.Font.Orientation = 45
Text alignment for Header Row
The text alignment of the header cells can be changed by using HeaderStyle.HorizontalAlignment and HeaderStyle.VerticalAlignment properties respectively.
//Change alignment for the header cells.
this.sfDataGrid1.Style.HeaderStyle.HorizontalAlignment = HorizontalAlignment.Center;
this.sfDataGrid1.Style.HeaderStyle.VerticalAlignment = System.Windows.Forms.VisualStyles.VerticalAlignment.Top;
'Change alignment for the header cells.
Me.sfDataGrid1.Style.HeaderStyle.HorizontalAlignment = HorizontalAlignment.Center
Me.sfDataGrid1.Style.HeaderStyle.VerticalAlignment = System.Windows.Forms.VisualStyles.VerticalAlignment.Top
Text wrapping for Header Row
The header text of the specific column can be wrapped using the GridColumnBase.AllowHeaderTextWrapping property.
this.sfDataGrid1.Columns["CustomerID"].AllowHeaderTextWrapping = true;Me.sfDataGrid1.Columns("CustomerID").AllowHeaderTextWrapping = True
Hiding Header Row
The header row can be hide by setting SfDataGrid.HeaderRowHeight property as 0 (zero).
this.sfDataGrid1.HeaderRowHeight = 0;Me.sfDataGrid1.HeaderRowHeight = 0
Freeze Panes
The rows and column can freeze in view like excel. The rows and columns can be freeze by setting following properties,
| Property Name | Description |
| Set the frozen rows count at top of the SfDataGrid. | |
| Set the footer rows count at bottom of the SfDataGrid. | |
| Set the frozen columns count in left side of the SfDataGrid. | |
| Set the footer columns in right side of the SfDataGrid. |
Freezing Rows
The rows can be freeze in view at top and bottom like Excel by setting the FrozenRowCount and FooterRowCount properties.
// Freeze rows at top
this.sfDataGrid1.FrozenRowCount = 3;

// Freeze rows at bottom
this.sfDataGrid1.FooterRowCount = 2;
' Freeze rows at top
Me.sfDataGrid1.FrozenRowCount = 3
' Freeze rows at bottom
Me.sfDataGrid1.FooterRowCount = 2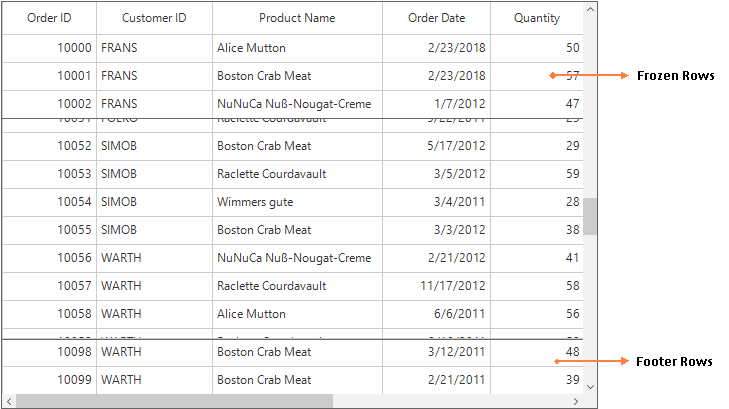
Freezing Columns
The columns can be freeze in view at left and right like Excel by setting the FrozenColumnCount and FooterColumnCount properties.
// Freeze columns at left
this.sfDataGrid1.FooterColumnCount = 2;

// Freeze columns at right
this.sfDataGrid1.FrozenColumnCount = 2;
' Freeze columns at left
Me.sfDataGrid1.FooterColumnCount = 2
' Freeze columns at right
Me.sfDataGrid1.FrozenColumnCount = 2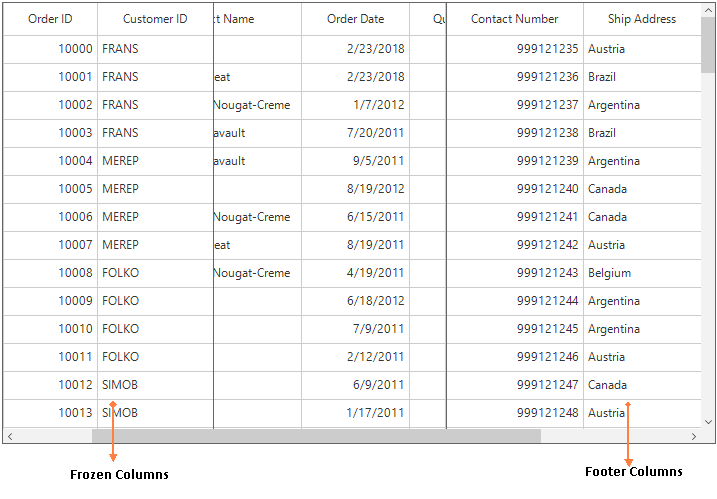
Appearance
Freeze Line Appearance
The appearance of freeze pane line can be customized by setting the FreezePaneLineStyle property. The FreezePaneLineStyle property contains all the settings that are needed for the freeze pane line appearance customization.
this.sfDataGrid1.Style.FreezePaneLineStyle.Color = System.Drawing.Color.BlueViolet;Me.sfDataGrid1.Style.FreezePaneLineStyle.Color = System.Drawing.Color.BlueViolet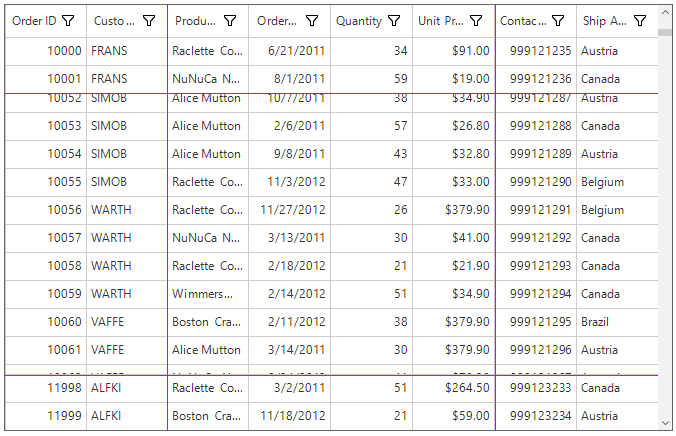
Freeze Line Weight
Freeze line weight or thickness can be changed by setting the FreezePaneLineStyle.Weight property.
this.sfDataGrid1.Style.FreezePaneLineStyle.Weight = 3;Me.sfDataGrid1.Style.FreezePaneLineStyle.Weight = 3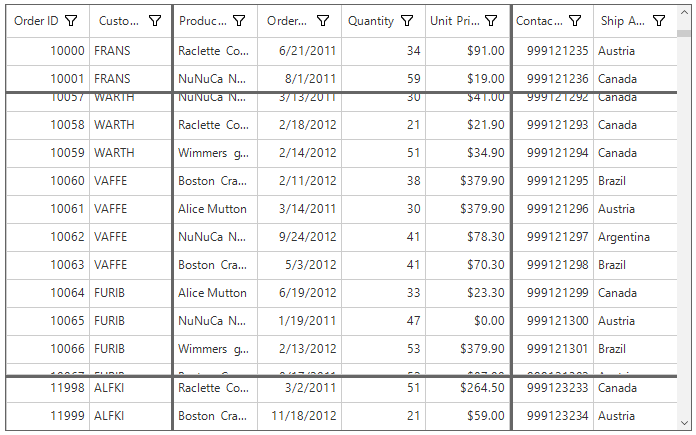
Changing the Freeze Line Style
An appearance of the freeze pane line can be customized by using DrawFreezePaneLine event. The freeze pane line type can be check by using LineType property which indicates freeze pane line type such as FrozenRow, FooterRow, FrozenColumn, FooterColumn. The e.Handled` property which is available in the
DrawFreezePaneLineArgs should be enabled to draw the custom line.
this.sfDataGrid1.DrawFreezePaneLine += SfDataGrid_DrawFreezePaneLine;

private void SfDataGrid_DrawFreezePaneLine(object sender, DrawFreezePaneLineArgs e)
{
    Pen pen=new Pen(Color.Red, 2);
    pen.DashStyle = DashStyle.Dash;
    if (e.LineType == LineType.FrozenRow || e.LineType == LineType.FooterRow || e.LineType == LineType.FooterColumn)
    {
        e.Graphics.DrawLine(pen, e.Point1, e.Point2);
        e.Handled = true;
    }
}
AddHandler sfDataGrid1.DrawFreezePaneLine, AddressOf SfDataGrid_DrawFreezePaneLine
Private Sub SfDataGrid_DrawFreezePaneLine(ByVal sender As Object, ByVal e As DrawFreezePaneLineArgs)
Dim pen As New Pen(Color.Red, 2)
pen.DashStyle = DashStyle.Dash
If e.LineType = LineType.FrozenRow OrElse e.LineType Is LineType.FooterRow OrElse e.LineType = LineType.FooterColumn Then
e.Graphics.DrawLine(pen, e.Point1, e.Point2)
e.Handled = True
End If
End Sub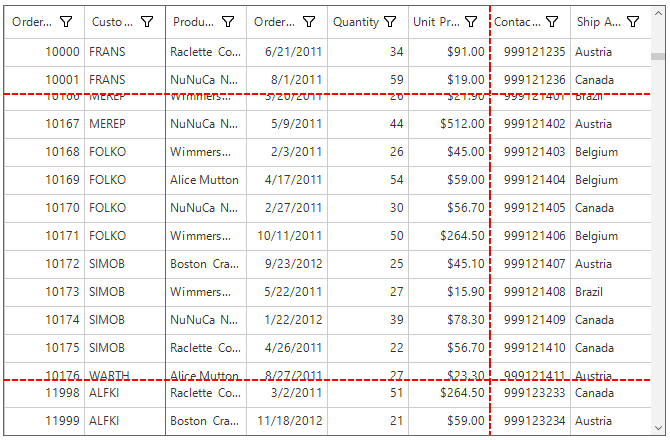
Changing the Back Color of Freeze Line based on Freeze Line LineType
By default, the back color of the freeze pane line cannot be changed based on the freeze pane line type. But it can be customized by drawing the line using the DrawFreezePaneLine event based on the freeze pane line type. The e.Handled property which is available in the DrawFreezePaneLineArgs should be enabled to draw the custom line.
this.sfDataGrid1.DrawFreezePaneLine += SfDataGrid_DrawFreezePaneLine;

private void SfDataGrid_DrawFreezePaneLine(object sender, DrawFreezePaneLineArgs e)
{
    if (e.LineType == LineType.FrozenRow)
    {
        e.Graphics.DrawLine(new Pen(Color. DeepSkyBlue, 2), e.Point1, e.Point2);
        e.Handled = true;
    }
    if (e.LineType == LineType.FooterRow)
    {
        e.Graphics.DrawLine(new Pen(Color. BlueViolet, 2), e.Point1, e.Point2);
        e.Handled = true;
    }
    if (e.LineType == LineType.FrozenColumn)
    {
        e.Graphics.DrawLine(new Pen(Color.Magenta, 2), e.Point1, e.Point2);
        e.Handled = true;
    }
    if (e.LineType == LineType.FooterColumn)
    {
        e.Graphics.DrawLine(new Pen(Color.Red, 2), e.Point1, e.Point2);
        e.Handled = true;
    }
}
AddHandler sfDataGrid1.DrawFreezePaneLine, AddressOf SfDataGrid_DrawFreezePaneLine
Private Sub SfDataGrid_DrawFreezePaneLine(ByVal sender As Object, ByVal e As DrawFreezePaneLineArgs)
If e.LineType = LineType.FrozenRow Then
e.Graphics.DrawLine(New Pen(Color.DeepSkyBlue, 2), e.Point1, e.Point2)
e.Handled = True
End If
If e.LineType Is LineType.FooterRow Then
e.Graphics.DrawLine(New Pen(Color.BlueViolet, 2), e.Point1, e.Point2)
e.Handled = True
End If
If e.LineType = LineType.FrozenColumn Then
e.Graphics.DrawLine(New Pen(Color.Magenta, 2), e.Point1, e.Point2)
e.Handled = True
End If
If e.LineType = LineType.FooterColumn Then
e.Graphics.DrawLine(New Pen(Color.Red, 2), e.Point1, e.Point2)
e.Handled = True
End If
End Sub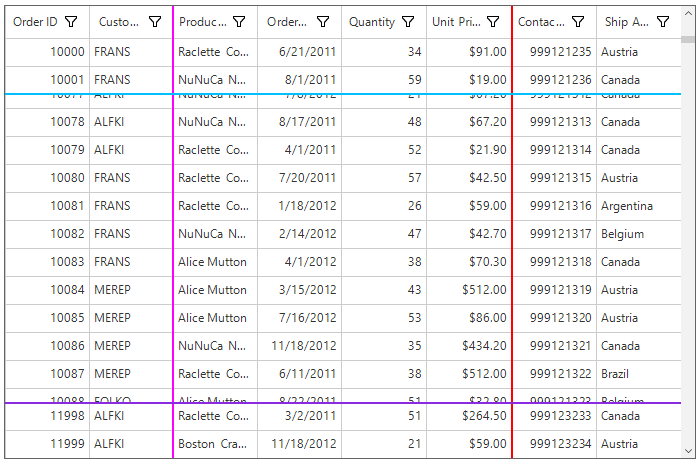
Loop through Records
The records in a view can be looped using SfDataGrid.View.Records collection.
foreach (var record in sfDataGrid1.View.Records)
{// Do your customizations here. }
For Each record In sfDataGrid1.View.Records
' Do your customizations here.
Next recordSee also
How to freeze particular column in WinForms DataGrid (SfDataGrid)
How to disable the scroll bars in the WinForms DataGrid (SfDataGrid)