Scatter Chart in WinUI Charts (SfCartesianChart)
2 Jan 20252 minutes to read
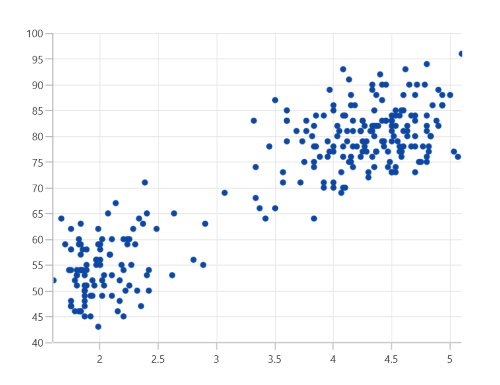
The WinUI Scatter Chart is similar to bubble chart, where each data point being represented by a circle with equal size.
Scatter Chart
To render a scatter chart, create an instance of the ScatterSeries, and add it to the Series collection property of SfCartesianChart. The segment size can be defined by using the PointHeight and PointWidth properties.
<chart:SfCartesianChart>

    <chart:SfCartesianChart.XAxes>
        <chart:NumericalAxis />
    </chart:SfCartesianChart.XAxes>

    <chart:SfCartesianChart.YAxes>
        <chart:NumericalAxis />
    </chart:SfCartesianChart.YAxes>

    <chart:SfCartesianChart.Series>
        <chart:ScatterSeries PointHeight="7"
                             PointWidth="7"
                             ItemsSource="{Binding Data}"
                             XBindingPath="XValue"
                             YBindingPath="YValue"/>
    </chart:SfCartesianChart.Series>

</chart:SfCartesianChart>
SfCartesianChart chart = new SfCartesianChart();
NumericalAxis xAxis = new NumericalAxis();
chart.XAxes.Add(xAxis);
NumericalAxis yAxis = new NumericalAxis();
chart.YAxes.Add(yAxis);
ScatterSeries series = new ScatterSeries()
{
ItemsSource = new ViewModel().Data,
XBindingPath = "XValue",
YBindingPath = "YValue",
PointHeight = 7,
PointWidth = 7,
};
chart.Series.Add(series);
this.Content = chart;
NOTE
You can also explore our WinUI Scatter Chart example that shows how to easily configure with built-in support for creating stunning visual effects.