Area Chart in WinUI Charts (SfCartesianChart)
10 Jul 20265 minutes to read
Area Chart
The WinUI Area Chart is rendered by using a collection of line segments connected to form a closed loop area, filled with the specified color. To render a area chart, create an instance of AreaSeries and add it to the Series collection property of the chart.
<chart:SfCartesianChart>
    <chart:SfCartesianChart.XAxes>
        <chart:CategoryAxis/>
    </chart:SfCartesianChart.XAxes>

    <chart:SfCartesianChart.YAxes>
        <chart:NumericalAxis/>
    </chart:SfCartesianChart.YAxes>

    <chart:SfCartesianChart.Series>
        <chart:AreaSeries
            ItemsSource="{Binding Data}"
            XBindingPath="Demand"
            YBindingPath="Year2010"/>
    </chart:SfCartesianChart.Series>
</chart:SfCartesianChart>
SfCartesianChart chart = new SfCartesianChart();
CategoryAxis xAxis = new CategoryAxis();
chart.XAxes.Add(xAxis);
NumericalAxis yAxis = new NumericalAxis();
chart.YAxes.Add(yAxis);
AreaSeries series = new AreaSeries()
{
ItemsSource = new ViewModel().Data,
XBindingPath = "Demand",
YBindingPath = "Year2010",
};
chart.Series.Add(series);
this.Content = chart;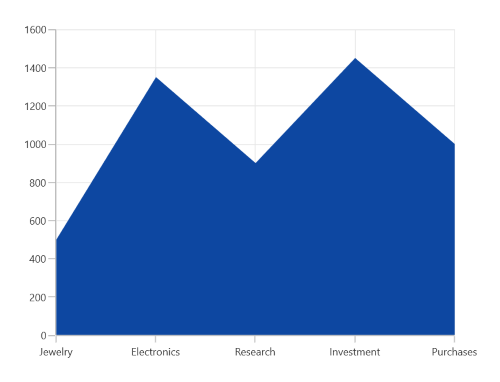
Spline Area Chart
The SplineAreaSeries connects a series of data points using smooth bezier line curves, with the underlying areas filled.
<chart:SfCartesianChart>
    <chart:SfCartesianChart.XAxes>
        <chart:CategoryAxis/>
    </chart:SfCartesianChart.XAxes>

    <chart:SfCartesianChart.YAxes>
        <chart:NumericalAxis/>
    </chart:SfCartesianChart.YAxes>

    <chart:SfCartesianChart.Series>
        <chart:SplineAreaSeries
            ItemsSource="{Binding Data}"
            XBindingPath="Demand"
            YBindingPath="Year2010"/>
    </chart:SfCartesianChart.Series>
</chart:SfCartesianChart>
SfCartesianChart chart = new SfCartesianChart();
CategoryAxis primaryAxis = new CategoryAxis();
chart.XAxes.Add(primaryAxis);
NumericalAxis secondaryAxis = new NumericalAxis();
chart.YAxes.Add(secondaryAxis);
SplineAreaSeries series = new SplineAreaSeries()
{
ItemsSource = new ViewModel().Data,
XBindingPath = "Demand",
YBindingPath = "Year2010",
};
chart.Series.Add(series);
this.Content = chart;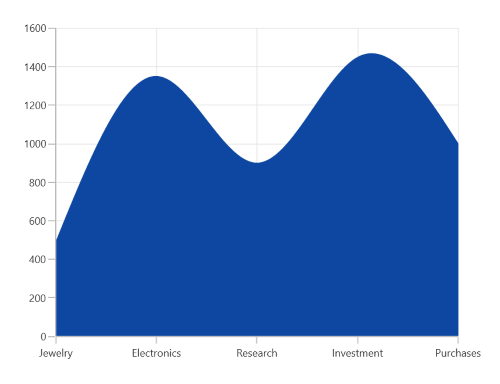
NOTE
You can refer to our WinUI Spline Area Chart feature tour page for its groundbreaking feature representations. You can also explore our WinUI Spline Area Chart example that shows how to easily configure with built-in support for creating stunning visual effects.
Step Area Chart
The StepAreaSeries is similar to AreaSeries, but it does not use the shortest distance to connect the two data points using bezier curves. Instead, this series uses vertical and horizontal lines to connect the data points in a series forming a step-like progression.
<chart:SfCartesianChart>
    <chart:SfCartesianChart.XAxes>
        <chart:CategoryAxis/>
    </chart:SfCartesianChart.XAxes>

    <chart:SfCartesianChart.YAxes>
        <chart:NumericalAxis/>
    </chart:SfCartesianChart.YAxes>

    <chart:SfCartesianChart.Series>
        <chart:StepAreaSeries
            XBindingPath="XValue"
            YBindingPath="YValue"
            ItemsSource="{Binding Data}"/>
    </chart:SfCartesianChart.Series>

    <!-- Configure additional chart elements -->
</chart:SfCartesianChart>
SfCartesianChart chart = new SfCartesianChart();
CategoryAxis xAxis = new CategoryAxis();
chart.XAxes.Add(xAxis);
NumericalAxis yAxis = new NumericalAxis();
chart.YAxes.Add(yAxis);
StepAreaSeries series = new StepAreaSeries()
{
ItemsSource = new ViewModel().Data,
XBindingPath = "XValue",
YBindingPath = "YValue",
};
chart.Series.Add(series);
this.Content = chart;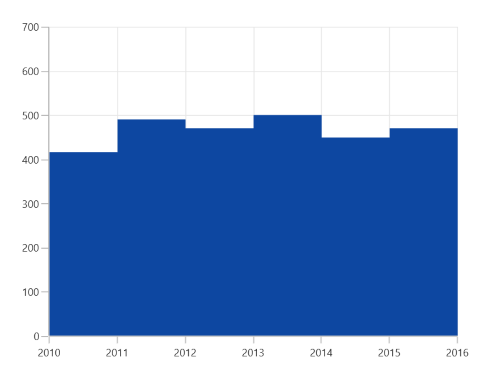
NOTE
You can refer to our WinUI Step Area Chart feature tour page for its groundbreaking feature representations. You can also explore our WinUI Step Area Chart example that shows how to easily configure with built-in support for creating stunning visual effects.
See Also