Column Chart in WinUI Chart (SfCartesianChart)
10 Jul 20263 minutes to read
WinUI Column Chart is used to plot discrete rectangles for the given data point values. To render a column chart, create an instance of ColumnSeries, and add it to the Series collection property of SfCartesianChart.
<chart:SfCartesianChart>
    <chart:SfCartesianChart.XAxes>
        <chart:CategoryAxis/>
    </chart:SfCartesianChart.XAxes>

    <chart:SfCartesianChart.YAxes>
        <chart:NumericalAxis/>
    </chart:SfCartesianChart.YAxes>

    <chart:SfCartesianChart.Series>
        <chart:ColumnSeries
            ItemsSource="{Binding Data}"
            XBindingPath="XValue"
            YBindingPath="YValue"/>
    </chart:SfCartesianChart.Series>
</chart:SfCartesianChart>
SfCartesianChart chart = new SfCartesianChart();
CategoryAxis xAxis = new CategoryAxis();
chart.XAxes.Add(xAxis);
NumericalAxis yAxis = new NumericalAxis();
chart.YAxes.Add(yAxis);
ColumnSeries series = new ColumnSeries()
{
ItemsSource = new ViewModel().Data,
XBindingPath = "XValue",
YBindingPath = "YValue",
};
chart.Series.Add(series);
this.Content = chart;
Segment spacing
The SegmentSpacing property is used to change the spacing between two segments. The default value of spacing is 0, and the value ranges from 0 to 1. Here, 1 and 0 correspond to 100% and 0% of the available space, respectively.
<chart:SfCartesianChart>
    <chart:SfCartesianChart.XAxes>
        <chart:CategoryAxis/>
    </chart:SfCartesianChart.XAxes>

    <chart:SfCartesianChart.YAxes>
        <chart:NumericalAxis/>
    </chart:SfCartesianChart.YAxes>

    <chart:SfCartesianChart.Series>
        <chart:ColumnSeries
            ItemsSource="{Binding Data}"
            XBindingPath="XValue"
            YBindingPath="YValue"
            SegmentSpacing="0.5"/>
    </chart:SfCartesianChart.Series>
</chart:SfCartesianChart>
SfCartesianChart chart = new SfCartesianChart();
CategoryAxis xAxis = new CategoryAxis();
chart.XAxes.Add(xAxis);
NumericalAxis yAxis = new NumericalAxis();
chart.YAxes.Add(yAxis);
ColumnSeries series = new ColumnSeries()
{
ItemsSource = new ViewModel().Data,
XBindingPath = "XValue",
YBindingPath = "YValue",
SegmentSpacing = 0.5
};
chart.Series.Add(series);
this.Content = chart;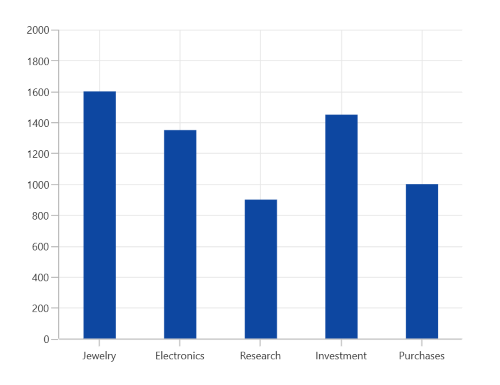
NOTE
You can also explore our WinUI Column Chart example that shows how to easily configure with built-in support for creating stunning visual effects.