Bubble Chart in WinUI Chart (SfCartesianChart)
10 Jul 20262 minutes to read
Bubble Chart
The BubbleSeries is represented by closely packed circles, whose areas are proportional to the quantities. The size of the bubble series is relative proportional to the value bind with the series using the Size property. You can set the constraints on this size using the MinimumRadius and MaximumRadius properties.
To render a bubble series, create an instance of BubbleSeries and add to the Series collection property of SfCartesianChart as shown in the following code.
<chart:SfCartesianChart>
    <chart:SfCartesianChart.XAxes>
        <chart:CategoryAxis/>
    </chart:SfCartesianChart.XAxes>

    <chart:SfCartesianChart.YAxes>
        <chart:NumericalAxis/>
    </chart:SfCartesianChart.YAxes>

    <chart:BubbleSeries
        ItemsSource="{Binding Data}"
        XBindingPath="XValue"
        YBindingPath="YValue"
        Size="Size"
        MinimumRadius="5"
        MaximumRadius="10"/>

    <!-- Configure additional chart elements -->
</chart:SfCartesianChart>
SfCartesianChart chart = new SfCartesianChart();
CategoryAxis xAxis = new CategoryAxis();
chart.XAxes.Add(xAxis);
NumericalAxis yAxis = new NumericalAxis();
chart.YAxes.Add(yAxis);
// Configure additional chart elements
BubbleSeries series = new BubbleSeries()
{
ItemsSource = new ViewModel().Data,
XBindingPath = "XValue",
YBindingPath = "YValue",
Size = "Size",
MinimumRadius = 5,
MaximumRadius = 10
};
chart.Series.Add(series);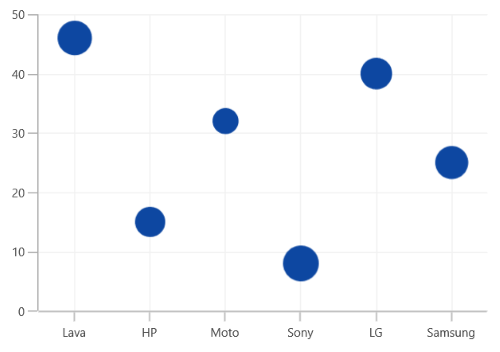
NOTE
Refer to our WinUI Bubble Chart feature tour page for its groundbreaking feature representations. You can also explore our WinUI Bubble Chart example that shows how to easily configure with built-in support for creating stunning visual effects.